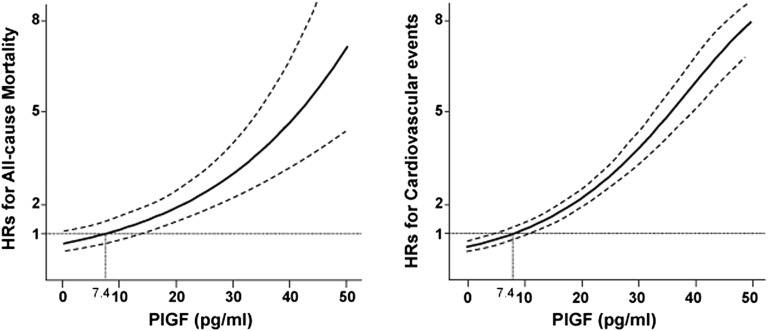
Figure 2.
Multivariable-adjusted HRs for all-cause mortality and for cardiovascular events over the distribution of serum PlGF concentrations. The median of the lowest quartile of PlGF concentration served as the reference group (7.4 pg/ml). The Cox model was adjusted for age, sex, diabetes, hypertension, dyslipidemia, obesity, smoking, previous coronary artery disease, previous stroke, CKD stage, hemoglobin, serum albumin, calcium, phosphorus, C-reactive protein, HbA1c, LDL cholesterol, HDL cholesterol, triglycerides, and use of RAS blockers, calcium channel blockers, β-blockers, mineralocorticoid receptor antagonists, lipid-lowering agents, diuretics, and antiplatelet agents. The solid lines show HRs for mortality and cardiovascular events. Dashed lines indicate 95% CIs.

