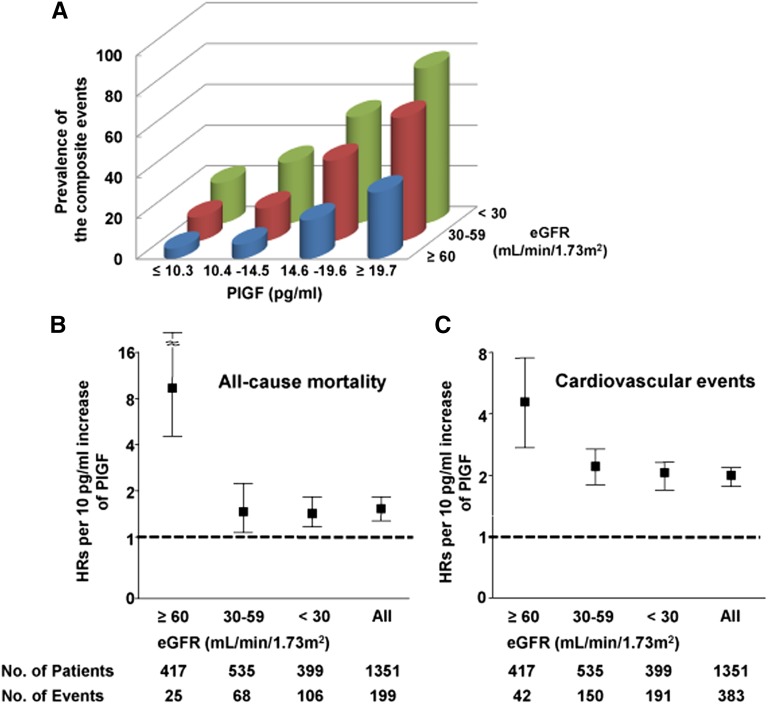
Figure 4.
PlGF levels and the risk of mortality and cardiovascular events on the basis of renal function. (A) The prevalence of the composite end point of mortality and cardiovascular events according to categories of PlGF and eGFR. (B) and (C) Multivariable-adjusted HRs (95% CIs) for all-cause mortality and cardiovascular events for each 10 pg/ml increase in PlGF levels on the basis of renal function. Bars represent 95% CIs.

