Figure 1.
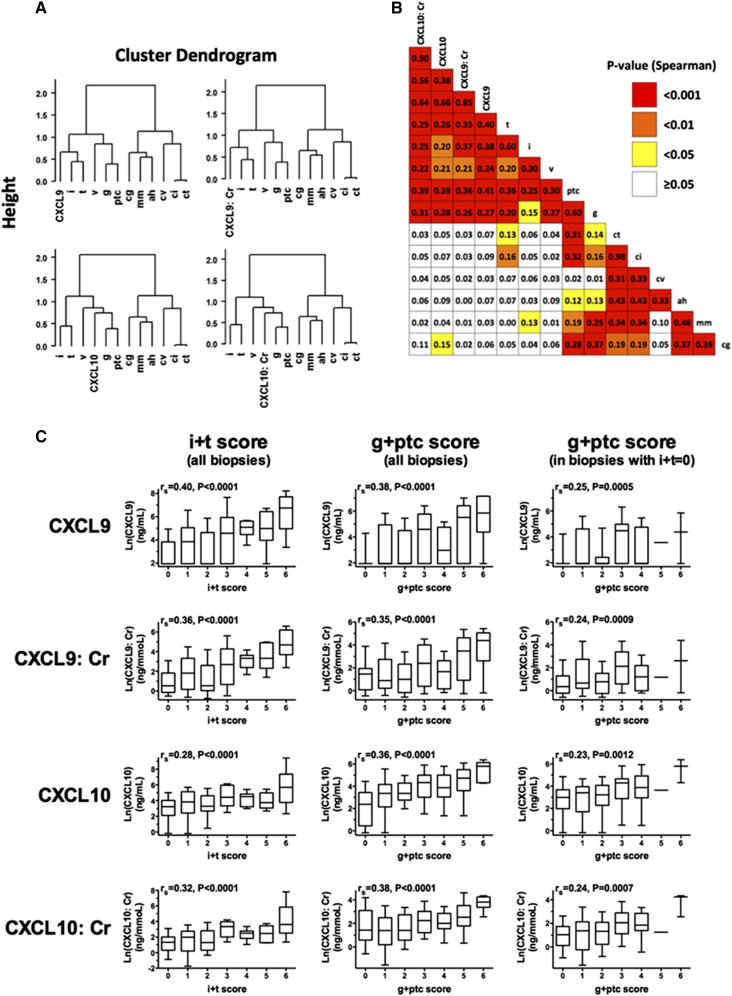
Urinary CXCL9 and CXCL10 levels, normalized or not by urine creatinine, correlated well with the extent of tubulointerstitial inflammation and microvascular inflammation. (A) Dendrogram representations of unsupervised hierarchical clustering analysis of acute and chronic Banff elementary scores of 281 biopsies and CXCL9 and CXCL10 levels normalized or not with urine creatinine. The vertical axis of the dendrogram represents the distance or dissimilarity between clusters. The dendrograms show a high association of CXCL9 and CXCL10, normalized or not with urine creatinine, with all acute Banff scores (i, t, g, ptc, and v). CXCL10 and CXCL10:Cr were found to be most significantly correlated with the microcirculation scores (g and ptc), whereas CXCL9 and CXCL9:Cr correlated most significantly with the cellular inflammation scores (i and t). (B) Spearman correlation matrix of Banff elementary lesions and urinary biomarkers. The color of each box indicates the P value. (C) Correlation of four urinary biomarker levels with the tubulointerstitial inflammation burden (indicated by the g+ptc score) with or without concomitant tubulointerstitial inflammation. Box-and-whisker plots show the log (natural)–transformed urinary biomarker levels. The horizontal line within each box represents the median, the bottom and top of each box represent the 25th and 75th percentile values, respectively, and the I bars represent the 10th and 90th percentile values. Spearman’s correlation coefficient (rs) and corresponding P values are shown.

