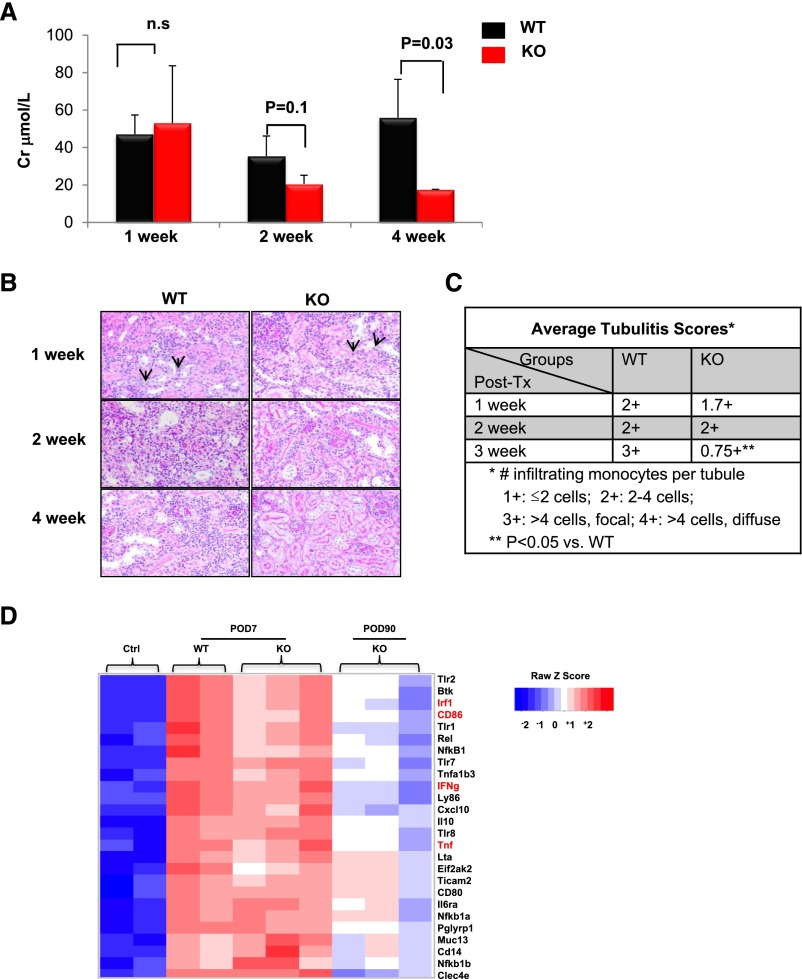
Figure 2.
Early immune response is similar in both WT and MyD88−/− allografts. (A) Serum creatinine (Cr) levels in WT or MyD88−/− knockout (KO) recipient mice 1, 2, or 4 weeks after transplant. Results are expressed as the mean (±SEM) of at least 4 independent experiments. n.s., not significant. (B) Representative histologic sections (periodic acid-Schiff staining) of kidney graft infiltrating leukocytes in WT or MyD88−/− allograft mice 1, 2, or 4 weeks after transplant. Original magnification, ×20. n=≥4 mice per group. (C) Tubulitis scores as determined by the number of infiltrating cells per tubule. (D) Heat map representing color-coded expression levels of different genes within the allograft (up- or downregulated >2-fold) from four groups: naive kidneys, not transplanted (ctrl 1 and 2), allografts from WT recipients 7 days after transplantation (WT D7 1 and 2), allografts from MyD88−/− recipients 7 days after transplantation (KO D7 1, 2 and 3), and allografts from MyD88−/− recipients 90 days after transplantation (KO D90 1, 2 and 3). Red indicates overexpressed genes (expression levels over the median) and blue indicates under-expressed genes (expression levels under the median; see legend). Data are shown in a matrix format: Each row represents a single gene, and each column represents a mouse. Because few WT recipients ever survived beyond POD90, they were not included in the analysis.

