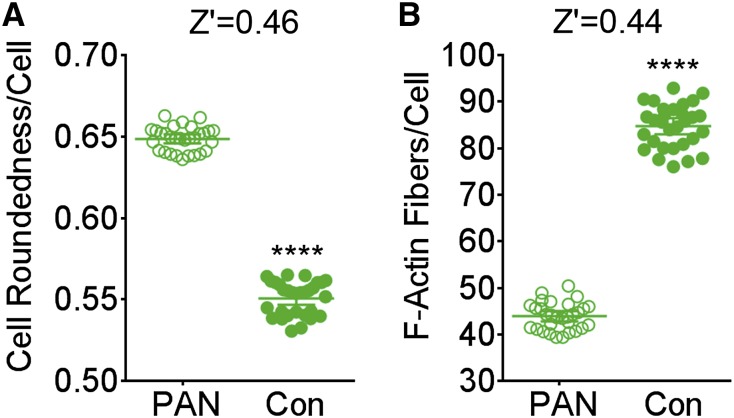
Figure 3.
Podocyte phenotypic assay has low variability. Graphs showing analysis of assay variability of the newly developed podocyte cell–based assay using automated microscope–based quantification of (A) cell roundness (morphology) or (B) F-actin fibers. Each graph shows quantified per-cell parameters from individual wells per condition (n=500–1000 cells per well) and the calculated means±95% confidence intervals across 30 wells and is representative of at least two independent assays. The calculated Z' value between cells treated with PAN alone (damaged) or media alone (Con) is also shown. In both types of analyses, Z' value is >0.44. ****P<0.001.

