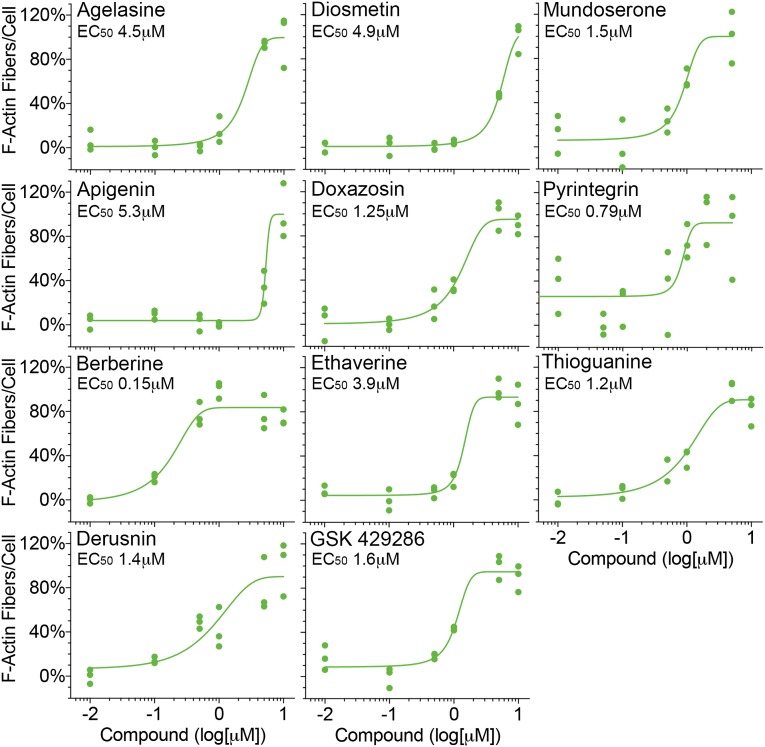
Figure 5.
Independent assays with select primary hits show dose-dependent protection of podocytes, confirming their validity as a hit. Graphs showing dose-dependent protection of podocytes from PAN injury by compounds identified in the primary screen. The name of each of the selected active compounds is shown on each graph. Podocytes in 96-well optical plates were incubated with PAN (16 μg/ml) at 37°C for 48 hours in the presence of increasing doses of each of the selected compounds, and the cellular damage was quantified by measuring change in F-actin fibers per cell. F-actin fiber counts from podocytes treated with PAN alone (16 μg/ml; negative control) or PAN (16 μg/ml) and MZR (5 μg/ml; positive control) were set at 0% and 100%, respectively, to normalize the data. Each data point on the graphs represents normalized per-cell F-actin fiber count from individual wells per condition (n=500–1000 cells per well). Curve fitting was used to calculate apparent half–maximal effective concentration (EC50) values (green line) and shows a dose-dependent protection of podocytes from PAN damage by each compound.

