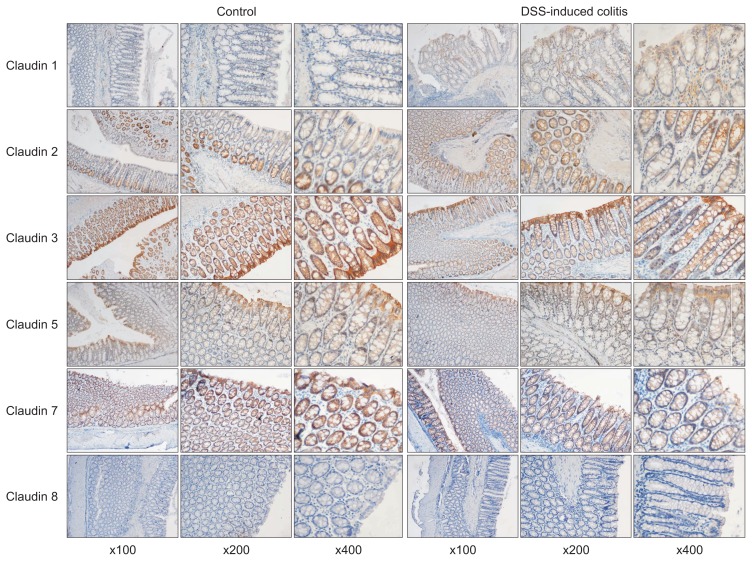
Fig. 2.
The expression of claudin 1 was absent in the control group, and there was faint labeling in the epithelial cells lining the crypts in the dextran sodium sulfate (DSS)-induced colitis group. Strong claudin 2 labeling was visible from the bottom of the crypts to the surface of the colonic mucosa in the DSS-induced colitis group; the gradient of expression visible in the controls was partly preserved. Strong expression of claudin 3 was observed in the colonic crypts and epithelium in both groups, but the expression levels were lower in the colonic mucosa of the colitis group. Claudin 5 and claudin 7 exhibited predominant expression on the top of the colonic crypts and at the base of the colonic epithelial cells in the control group, whereas there was decreased staining in the colitis group. Claudin 8 showed weak staining in the control group and absent expression in the colitis group (magnifications: left, ×100; middle, ×200; right, ×400).

