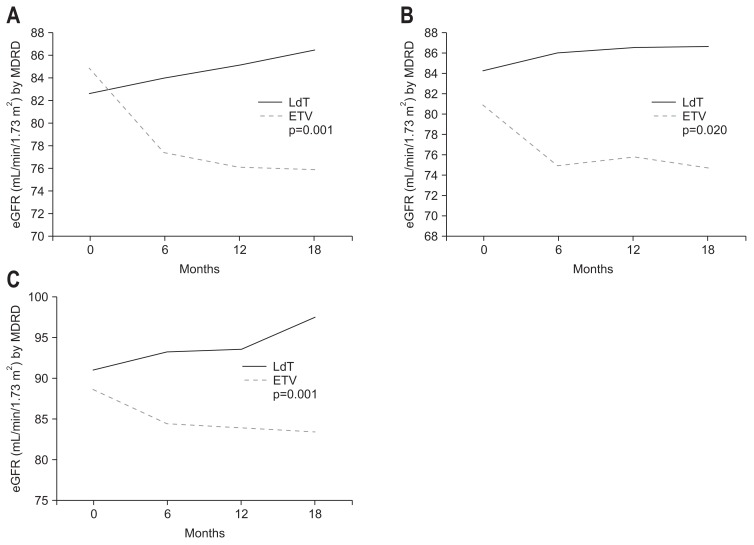
Fig. 3.
Evolution of renal function according to underlying disease. The black and gray bars indicate estimated glomerular filtration rate (eGFR; mL/min/1.73 m2) with telbivudine (LdT) and entecavir (ETV) treatment, respectively. The eGFR rose in LdT-treated patients but decreased in patients given ETV. (A) Diabetes mellitus. (B) Hypertension. (C) Cirrhosis.
MDRD, Modification of Diet in Renal Disease.

