Fig. 1.

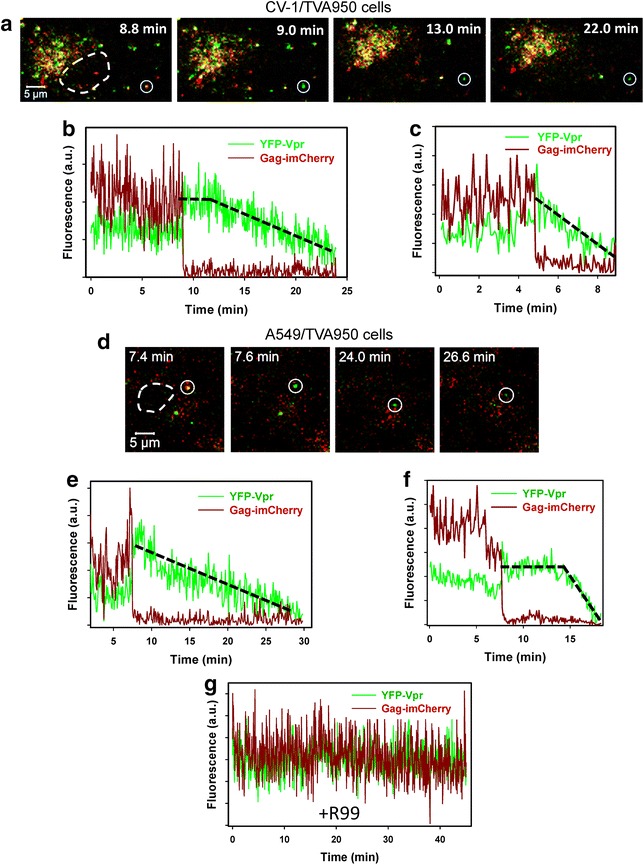
Post-fusion decay of HIV-1 YFP-Vpr signal. a, d ASLVpp co-labeled with the core-associated YFP-Vpr (green) and a releasable content marker Gag-imCherry (dark red) were pre-bound in the cold to CV-1/TVA950 (a–c, g) or A549/TVA950 (d–f) cells expressing the ASLV receptor TVA950. Entry was initiated by introducing warm buffer, and cells were maintained at 37 °C for 45 min and imaged every 3–5 s. Fusing viruses were detected by the near-instantaneous disappearance of mCherry from double-labeled particles (marked by white circles in a and d). White dashed lines show the boundaries of cell nuclei. b, c Fluorescence intensity profiles (total fluorescence of YFP-Vpr and Gag-imCherry) obtained by single ASLVpp tracking in CV-1-derived cells. e, f Fluorescence intensity profiles for YFP-Vpr and Gag-imCherry obtained by single ASLVpp tracking in an A549-derived cell. g An example of YFP-Vpr and Gag-imCherry signals from a non-fusing particle selected from an experiment carried out in the presence of the ASLV fusion inhibitor R99 (50 μg/ml). Black dashed lines outline different YFP decay profiles occurring without (c, e) and with a lag (b, f) after the release of mCherry. Here and in Fig. 2, the abrupt ending of fluorescence traces occurs due to the inability to track faint YFP/GFP-Vpr puncta using particle tracking software, as the signal approaches the background level
