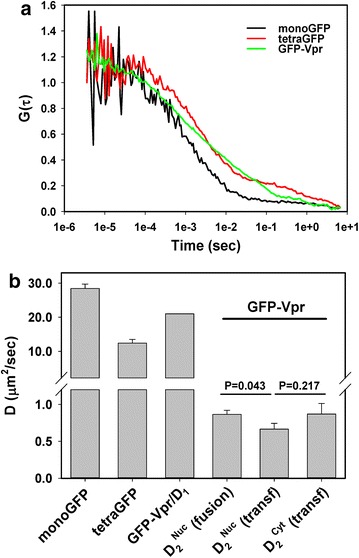
Fig. 9.

Cellular GFP-Vpr mobility analysis by fluorescence correlation spectroscopy. a Representative autocorrelation curves for monomeric and tetrameric GFP expressed in A549 cells, as well as for nuclear GFP-Vpr delivered through fusion of ASLVpp co-labeled with GFP-Vpr and Gag-imCherry. b Diffusion coefficients obtained by curve fitting the autocorrelation plots in a, as described in “Methods” and in Additional file 3: Figure S10. Monomeric and tetrameric GFP curves were fit with a 3D single-component diffusion model, whereas the GFP-Vpr curves could only be fit with a 2-component diffusion equation. The faster diffusion coefficient D1 was assumed to correspond to an GFP-Vpr monomer and was fixed for curve fitting purposes in order to obtain D2 coefficient. Similar analysis was performed for GFP-Vpr expressed in A549 cells by transient transfection. Data are means and SEM from 6 to 12 experiments. Possible reasons for the unexpectedly large difference in D for a monomer and a tetramer compared to the predicted D − 1/(MW)1/3 relationship are discussed in [39]
