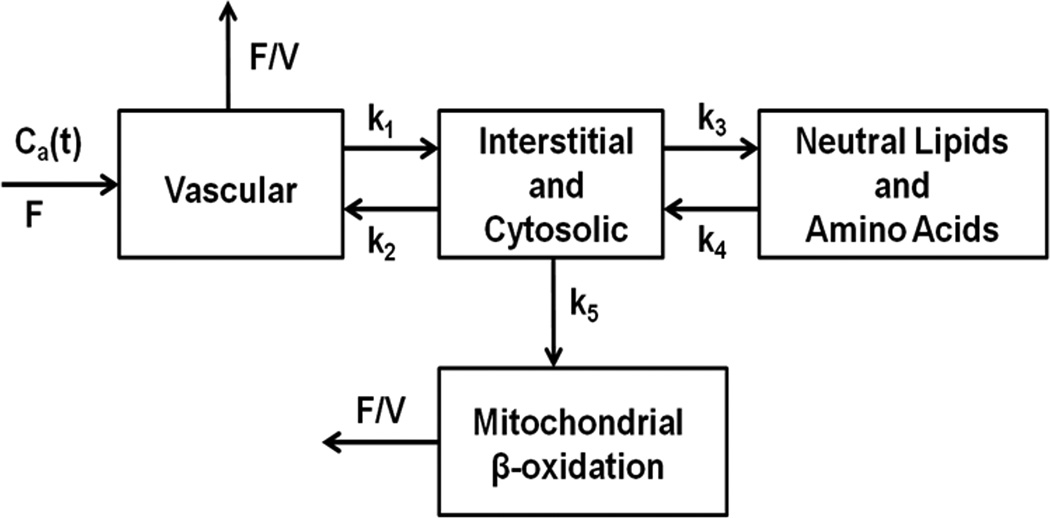
Figure 1. Block diagram of the 4-compartment model.
Compartment 1 represents the vascular space; 2, the interstitial and intracellular spaces; 3, neutral lipids, amino acids and other slow turnover pools; and 4, mitochondrial β-oxidation. kn represents the forward and backward rate constants between compartments, F is myocardial blood flow, V is fractional vascular volume and Ca(t) is arterial tracer concentration over time.

