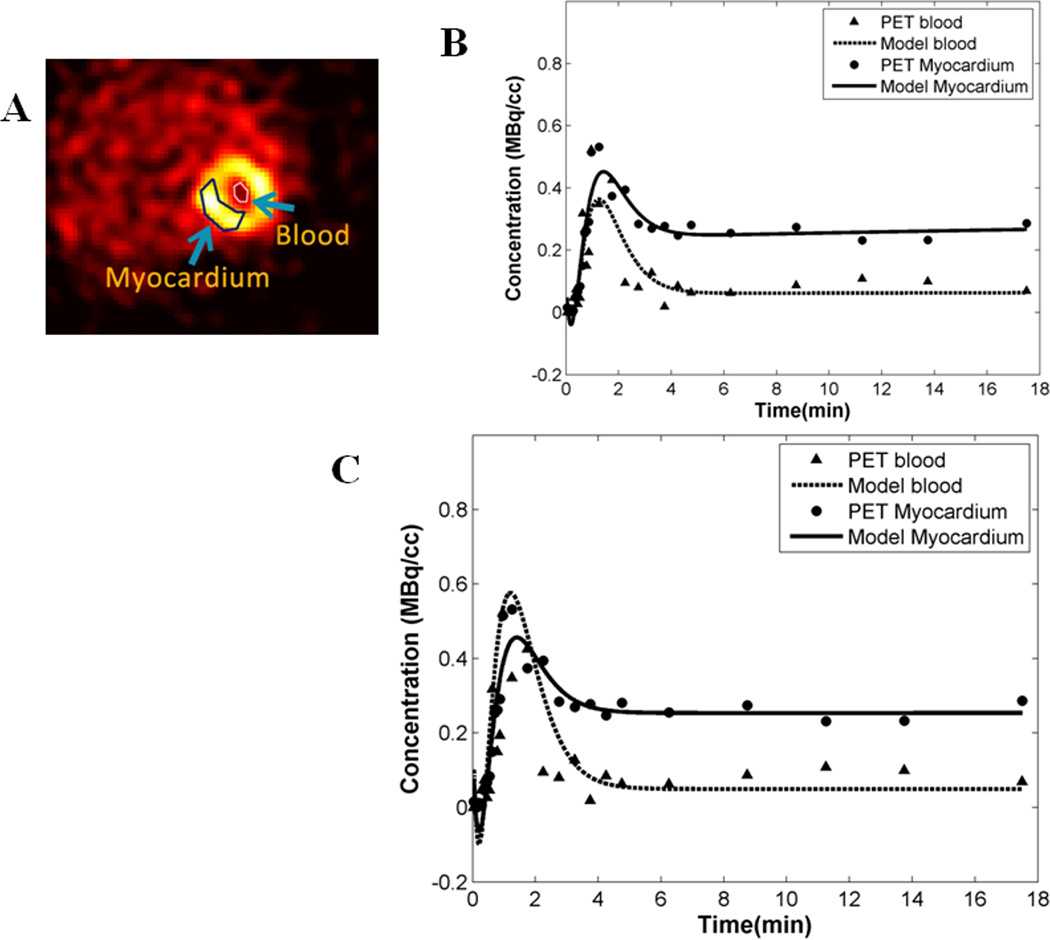
Figure 2. 11C-palmitate PET images of mouse heart in vivo.
(A) Example of a PET image at the last time frame of the dynamic data set. The image also exhibits regions of interest in the left ventricular blood pool and the myocardium. (B) Model fits to the blood and the myocardial time activity curves without interpolation. (C) Cubic spline interpolation resulted in improved fits especially at the peak region for the time activity curve obtained from the LV blood pool.

