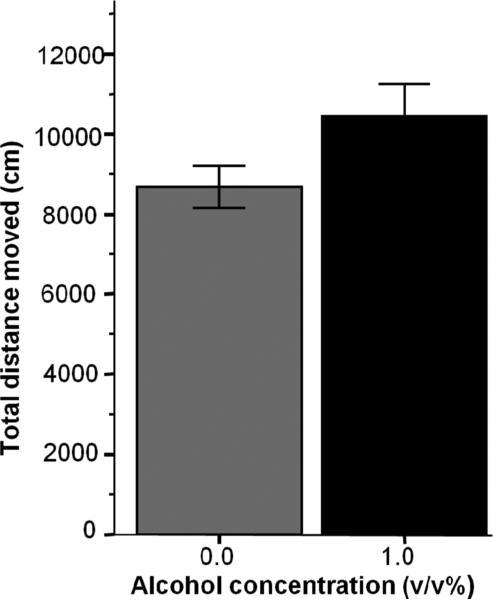
Figure 3.
Total distance swam by the adult experimental zebrafish during the 23-minute recording session does not significantly differ between the control (0.0%) and alcohol exposed (1.0%) fish. Mean ± SEM are shown. Sample sizes are given in the Methods section. The concentration of alcohol treatment (one exposure for 2 hours, 24th hour post fertilization) is shown under the x-axis.

