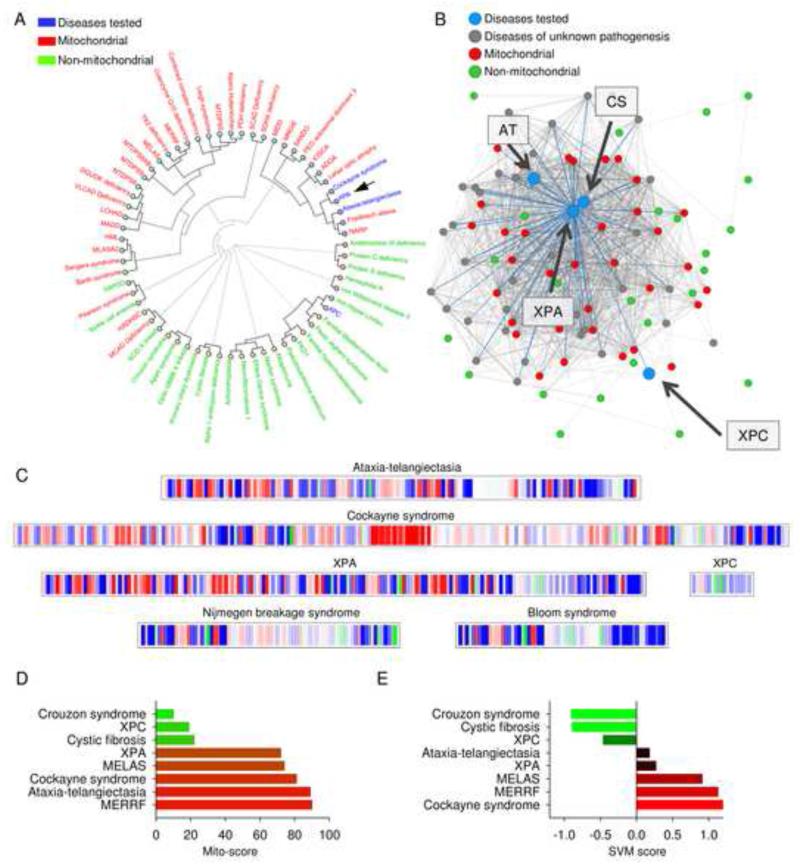
Figure 1. Patients suffering from XPA are phenotypically similar to patients suffering from mitochondrial diseases.
(A) Hierarchical clustering of diseases based on the prevalence of clinical parameters using mitodb.com. (B) A representation of how XPA, XPC, CS and AT associate within the disease network. Each dot represents a disease and the connecting lines represent one or more shared sign and/or symptom. The shorter and thicker the line the greater the prevalence of the shared symptoms. (C) The mitochondrial barcode of XPA, XPC, CS, AT, Nijmegen breakage syndrome and Bloom syndrome. Each vertical bare represent a sign or symptom that is shared with another disease in the database. Mitochondrial (red), non-mitochondrial (green) and diseases of unknown pathogenesis (blue). A predominantly red barcode will indicate similarities with mitochondrial diseases while green will indicate non-mitochondrial involvement. (D) and (E) The mito-score (D) and the support vector machine (SVM) score (E) of XPA, XPC, CS and AT as well as two non-mitochondrial diseases Crouzon syndrome and cystic fibrosis and two bona fide mitochondrial disorders mitochondrial myopathy, encephalopathy, lactic acidosis, and stroke-like episodes (MELAS) and myoclonic epilepsy associated with ragged-red fibers (MERRF). See also Table S1.

