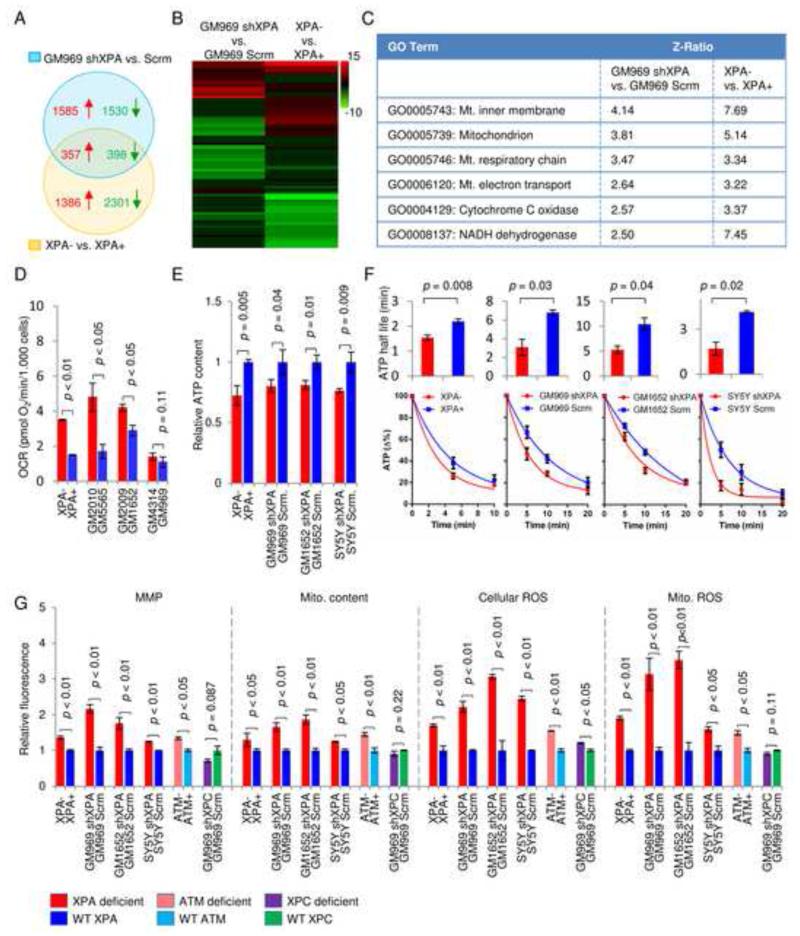
Figure 2. XPA deficiency increases mitochondrial metabolism, membrane potential and ROS formation.
(A) Venn diagrams illustrating the overlap of induced (red, z-score > 1.5) and repressed (green, z-score < −1.5) genes between two groups of XPA deficient cells by microarray (n=3). (B) Heat map of microarray data showing significantly changed GO-pathways. (C) Common statistically significantly upregulated mitochondrial pathways in XPA deficient cells compared with controls. Also see Figure S1A. (D) Oxygen consumption rates in primary fibroblasts from XPA patients and their age and sex matched controls (means ± SD, n=3). (E) and (F) ATP levels and ATP consumption in XPA deficient and control cells were detected using a luciferase based assay after inhibition of ATP production with oligomycin and 2-deoxyglucose at time=0 (means ± SD, n=3). Data in (F) was fitted to an exponential decay curve and half-lives were calculated (means ± SD, n=3). (G) Flow cytometry was used to measure mitochondrial membrane potential (MMP) using TMRM staining, mitochondrial content using MitoTracker Green, cellular reactive oxygen species (ROS) using dihydroethidium and mitochondrial ROS using Mitosox (means ± S.D., n=3). See also Figure S1 and Figure S2.

