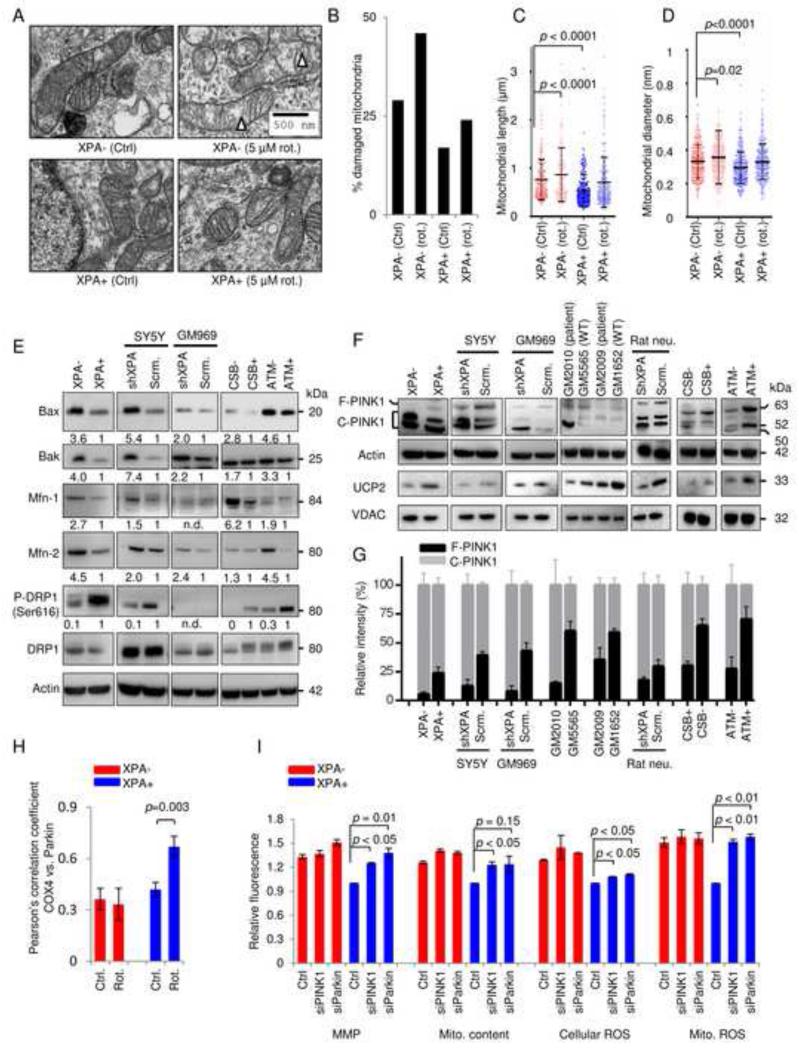
Figure 4. XPA deficiency suppresses mitophagy by up-regulation of mitochondrial fusion and cleavage of PINK1.
(A-D) XPA− and XPA+ cells were treated with 5 μM rotenone or vehicle for 24 h, and electron microscopy was performed (A). Triangles indicate damaged mitochondria. Quantification of damaged mitochondria (B), mitochondrial length (C) and mitochondrial diameter (D), (means ± S.D., n=14, with >150 mitochondria counted per group). (E) Immunoblot of proteins involved in mitochondrial size regulation. Bax, Bak, mitofusin-1 (Mfn-1), and Mfn-2 participate in mitochondrial fusion whereas phosphorylation of DRP1 at Ser616 is involved in mitochondrial fission. (F) Protein expression of PINK1 and UCP2 levels in XPA deficient cells and tissues. (G) Quantification of (F) showing full length and cleaved PINK1 normalized to total PINK1 (means ± S.D., n=3). (H) The colocalization between COX-4 and Parkin in XPA− and XPA+ cells treated with 5 μM rotenone for 24 h and quantified using the Pearson’s correlation coefficient (means ± S.D., n=3 and Figure S4D). (I) Various mitochondrial parameters in XPA+ and XPA− cells after siRNA knockdown of PINK1 and Parkin (means ± S.D., n=3 and Figure S4F-G for knockdown efficiency).

