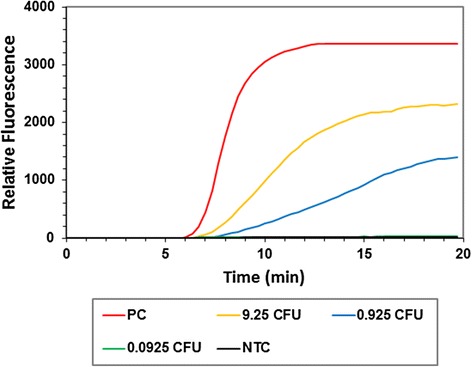
Fig. 4.

Blood spiking. The graph shows the fluorescence intensity obtained from the RPA of 1 μL purified DNA (9.25, 0.925 and 0.0925 CFU equivalents) extracted from whole blood spiked with varying CFU of S. pneumoniae (type strain; DSM20566). Also shown is the fluorescence intensity obtained from the amplification of 100 GE (positive control, PC) of S. pneumoniae (type strain; DSM20566) and a no template control reaction (NTC)
