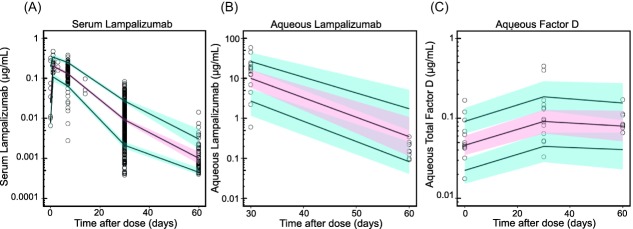
Figure 3.

Visual predictive checks (VPCs) of final model fitted to the combined ocular-serum dataset demonstrating good predictive power of concentration-time profiles of serum lampalizumab (a), aqueous humor lampalizumab (b), and aqueous humor total complement factor D (c). Black open circles represent observed data. Solid black lines represent 10th, 50th, and 90th percentiles of the simulation-based concentrations. Red regions represent 10th−90th confidence intervals of the 50th model-predicted concentrations. Blue regions represent the 10th−90th confidence intervals of the 10th and 90th model-predicted concentrations.
