
Figure 5.
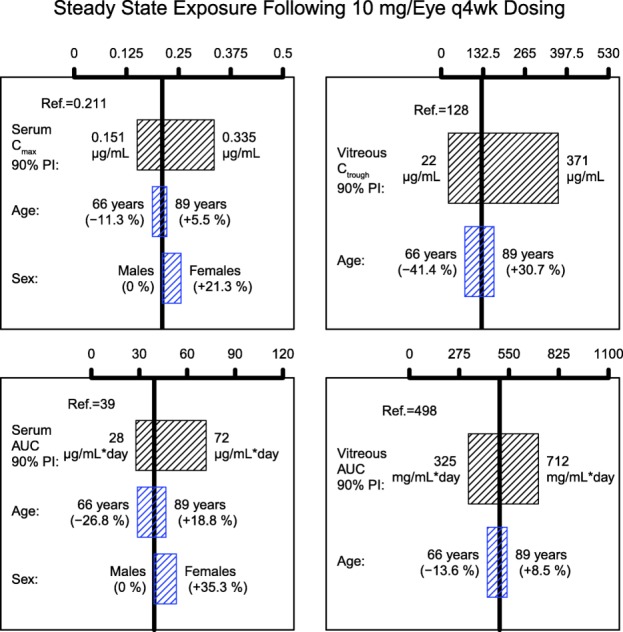
Impact of age and sex on serum and vitreous humor exposures. The black boxes illustrate the 90% prediction interval of individual exposures in the analysis population. The blue boxes correspond to the predictions of exposure for typical patients (80-year-old males) with the covariate values equal to 5th and 95th percentiles of the covariate distribution in the analysis population. AUC, area under the serum concentration time curve; Cmax, maximum concentration; Ctrough, minimum concentration; PI, prediction interval.