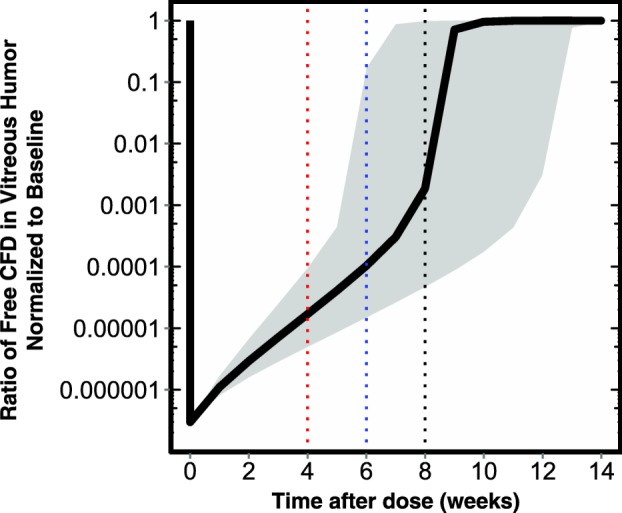
Figure 6.

Simulations of free target suppression in vitreous humor expressed as ratio of free target to baseline over time. Solid black line represents the model-predicted vitreous humor free target ratio (FTR) for a typical patient in the CFD4870g study. Shaded region represents the 5th−95th prediction interval. Red, blue, and black lines denote the minimum FTR at 4, 6, and 8 weeks following intravitreal (ITV) lampalizumab administration. Black lines denote trend for a typical patient in CFD4870g study and shaded regions represent 5th−95th prediction intervals.
