
Fig. 4.
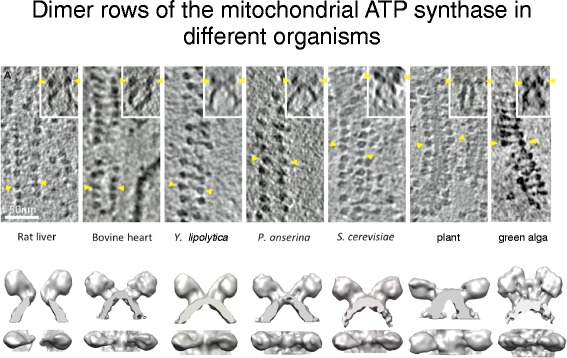
Double rows of ATP synthase in seven different species. Top row: slices of 3D volumes obtained by cryo-ET with rows of ATP synthase dimers. Insets show side views of the dimers in the membrane. Yellow arrowheads indicate F1 heads of one dimer. Scale bar = 50 nm. Bottom row: Surface representations of subtomogram averages. (Adapted from [17])