
Fig. 3.
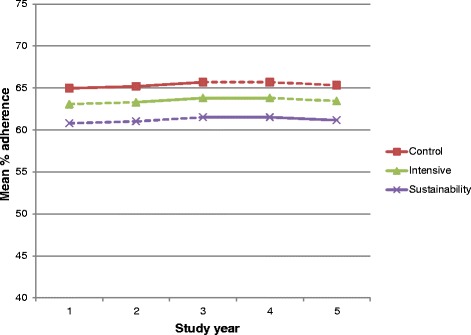
Estimated effect of the IDOCC intervention presented as adjusted mean adherence score (%) averaged over all practices in control, intensive, and sustainability conditions. The model assumes a single underlying secular trend across steps and estimates a shift in level as a result of the intervention. Solid lines represent time intervals with observed data in that condition; dashed lines represent time intervals with no observed data in that condition