
. 2015 Sep 8;150(6):473–483. doi: 10.1530/REP-15-0253
 This work is licensed under a
 Figure 2.
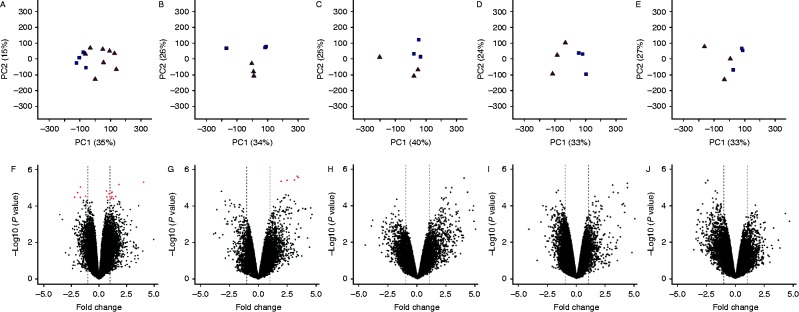
PCA and volcano plots for gene expressions in all oviductal segments (control vs mated individuals). First and second significant components (A, B, C, D and E) show 50, 60, 65, 57 and 60% variation in UVJ, uterus, isthmus, magnum and infundibulum respectively. Volcano plots (F, G, H, I and J) show up- and down-regulated gene expressions in UVJ, uterus, isthmus, magnum and infundibulum. The X-axis represents fold change (FC) in gene expression and Y-axis represents –log10 of P value. Vertical dashed lines represents logFC cut off values −1.00 or +1.00 and red dots represent differentially expressed genes (q≤0.05).