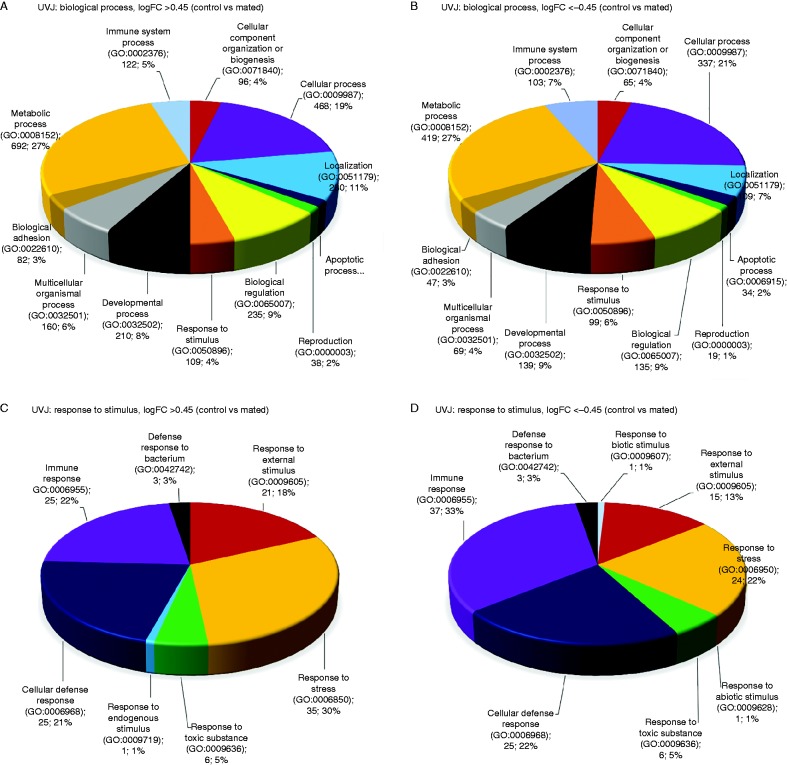
Figure 3.
Gene ontology (GO) analysis of differentially expressed (logFC either >0.45 or <−0.45) genes in UVJ (control vs mated individuals). Data label represents category name (Accession), number of genes and percent of gene hit against total number of biological process hits. (A) Total number of genes (n)=1539; total number of biological process hits (N)=2532. (B) n=1120; N=1575. (C) n=109; N=116. (D) n=99; N=112.

 This work is licensed under a