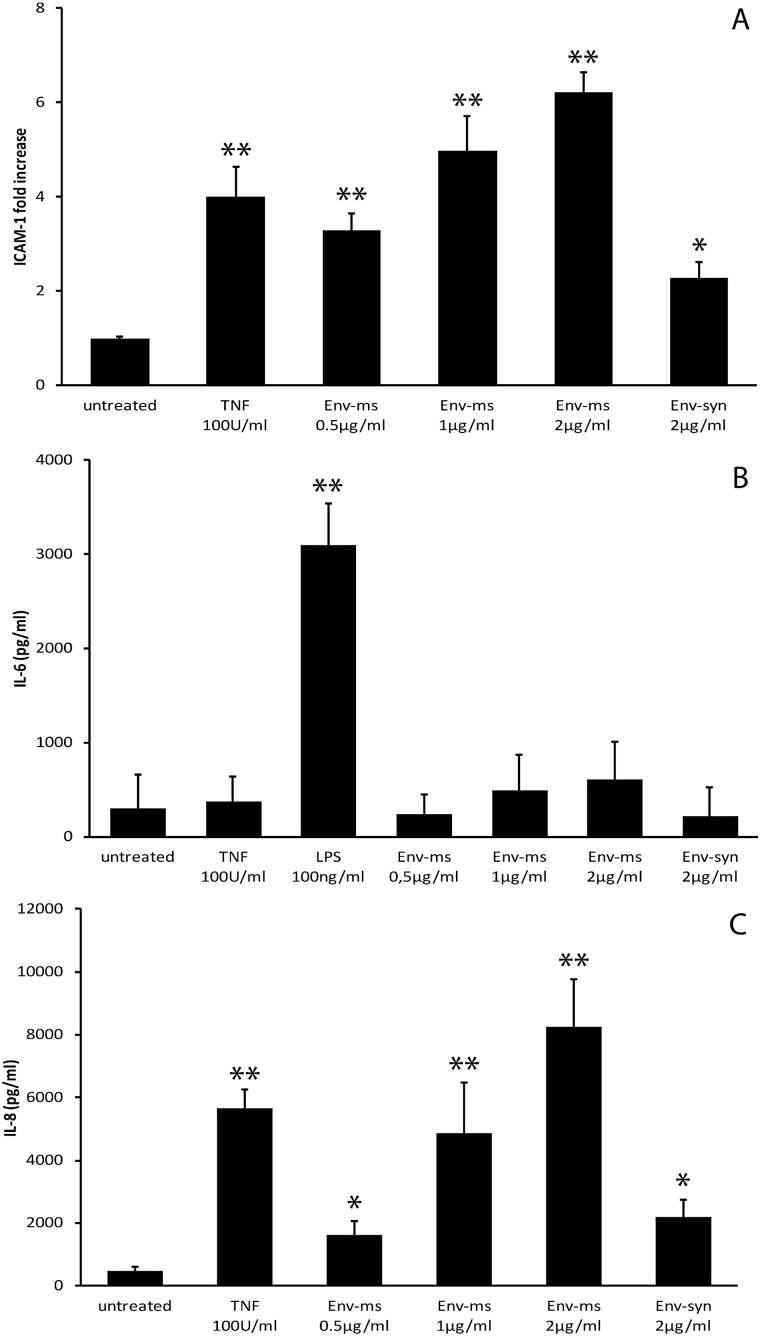
Fig. 3.
Env-ms has significant, but different effects on HUVECs, compared to HCMEC/D3 cells. (A) Flow cytometry analysis of ICAM-1 expression after overnight treatment of HUVECs with TNF-α, Env-ms or Env-syn. (B) Analysis of IL-6 production by HUVECs. Cells were treated overnight with TNF-α, Env-ms or Env-syn, IL-6 was measured with ELISA. (C) Analysis of IL-8 production by HUVECs. Same conditions as for IL-6 measurements. Results represent the mean ± SE of 2–4 independent experiments each performed in triplicate. *P ≤ 0.05; **P ≤ 0.001.

