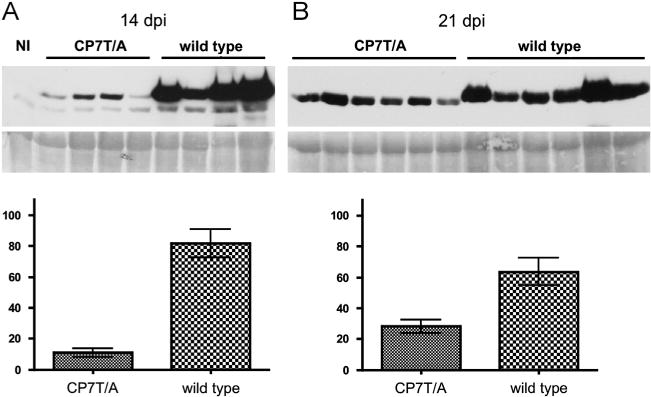
Fig. 4.

Effect of O-GlcNAcylation of CP on PPV accumulation in A. thaliana. Upper panels show a Western blot analysis of extracts of plants of A. thaliana Col-0 infected with the virus indicated above each lane, or of non-inoculated plants (NI), probed with antiserum to PPV CP. Samples were collected at 14 (A) or 21 (B) days post inoculation. The blots stained with Ponceau red showing the Rubisco are included as loading controls. Lower panels show the densitometric analysis of the Western blots. Values are percentages of the density of the most intense band in the blot. Each bar shows the average value and the standard deviation of the four or six infected plants analyzed in (A) or (B), respectively.
