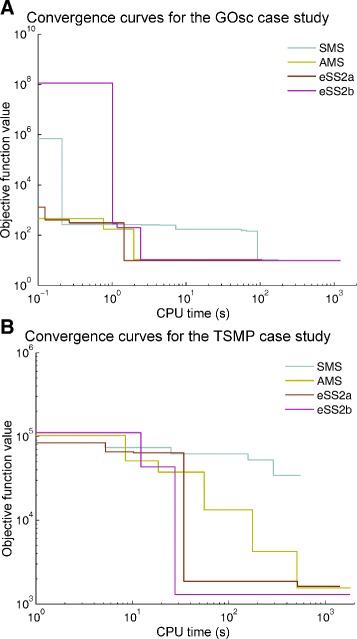
Fig. 4.

Comparison of convergence curves of selected optimization methods. The convergence curve shows the value of the objective function versus the computation time during the minimization (model calibration). Results are given for simple multi- start (SMS), advanced multi-start (AMS) and enhanced scatter search methods (eSS2a and eSS2b; see description in main text). Results are shown for two case studies: (a) GOsc and (b) TSMP
