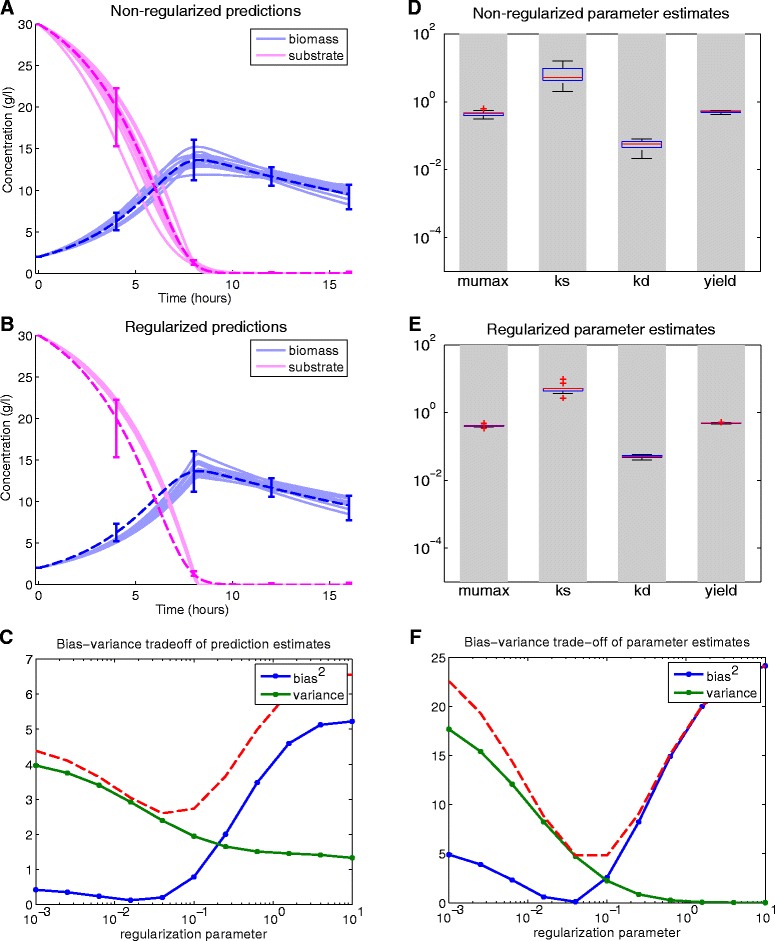
Fig. 6.

Bias-variance trade-off for the BBG case study. Figures a and b illustrate the nominal trajectory (dashed line) and the range of perturbed measurements together with predictions of calibrated models (continuous lines) without and with regularization, respectively. The distribution of the regularized predictions (in b) are narrower than in the non- regularized one (in a), but are slightly biased from the nominal trajectory. Figure c depicts the squared bias and the variance of these model predictions as a function of the regularization parameter. The mean square error (dashed line) has a minimum at 0.08. Figure d, e and f shows the results for the estimated parameters: with regularization the estimated parameters are less sensitive to perturbations in the data
