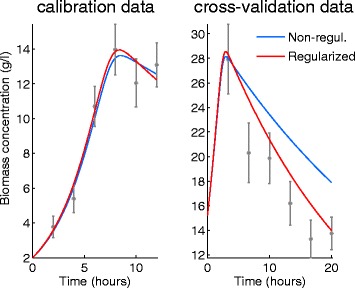
Fig. 8.

Calibration and cross-validation results for the BBG case study. Left figure shows calibration data fitted with non-regularized and regularized estimations (non-regularized, and regularized ). Right figure shows cross-validation data with the predictions from the non-regularized and regularized estimations. The regularized model shows a slightly worse fit to the calibration data but much better agreement with the cross-validation data. I.e. regularization results in a more generalizable model
