Fig. 1.

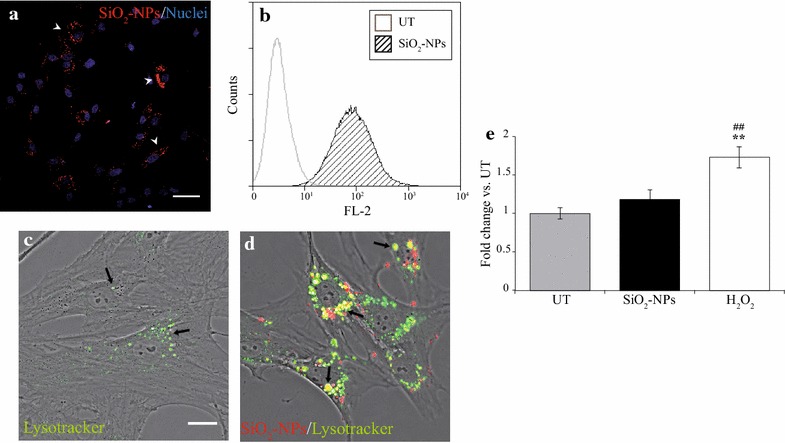
16 h exposure of hMSCs to 50 nm SiO2-NPs 50 µg·mL−1: cell labelling, intracellular localization and ROS production. a Staining of hMSCs with SiO2-NPs (red) after 16 h (t0). Nuclei were counterstained with Hoechst-33342 (blue). Magnification 40×, scale bar 50 µm. b Representative flow cytometry histogram of percentage hMSCs labelled with SiO2-NPs at t0. Untreated (UT) cells (white histogram) result negative for red fluorescence (FL-2), whereas labelled cells (SiO2-NPs, hatched histogram) emit strong red fluorescence due to internalized SiO2-NPs. c, d Confocal acquisitions of UT- (c) and SiO2-NPs-treated (d) hMSCs at t0 labelled with Lysotracker Green to reveal lysosomal compartments. Co-localization between fluorescent SiO2-NPs (red) and Lysotracker (green) was displayed by the system as yellow. Magnification 63×, scale bar 20 µm. e ROS production at t0 evaluated with DCFH-DA assay. hMSCs treated for 2 h with H2O2 600 µmol L−1 served as positive control. Fluorescent emission from each sample was normalized by the mean UT value. ** p < 0.01 vs. UT and ## p < 0.01 vs. SiO2-NPs
