Fig. 4.

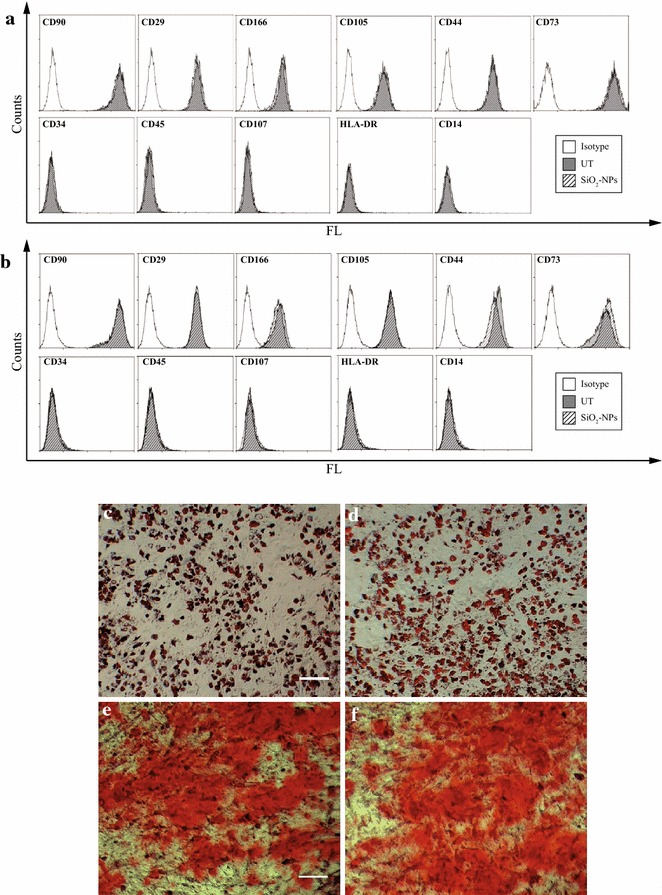
Assessment of stemness and differentiation potential in cultured hMSCs. Immunophenotypic characterization of UT and SiO2-NPs-treated hMSCs at t0 (a) and R 7d (b). An anti-isotype IgG was used as negative control for the reaction. c, d Representative images of UT (c) and SiO2-NPs (d) cells after 18 days of adipose differentiation. Lipid vacuoles are stained with Oil Red. Magnification 10×, scale bar 100 µm. (e, f) Representative pictures of UT- (e) and SiO2-NPs -exposed (f) hMSCs after 21 days of osteogenic differentiation. Alizarin Red was used to reveal extracellular deposition of calcium salts. Magnification 10×, scale bar 100 µm
