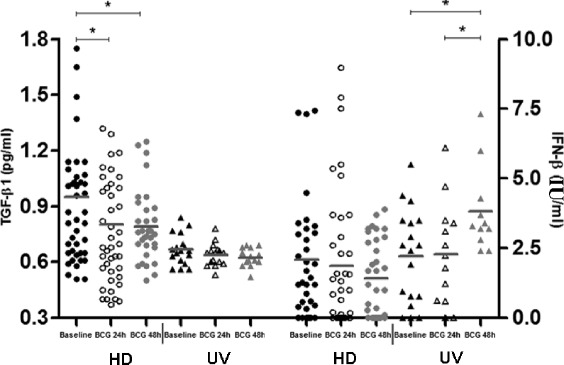
Fig. 3.

Transforming growth factor (TGF)-β1 levels (pg/ml) and Interferon (IFN)-β levels (IU/ml) in healthy donor (HD; n = 42) and umbilical vein (UV; n = 18) groups representing baseline and different times of in vitro BCG Moreau infection in human mononuclears. Horizontal bars represent mean values in each condition. *p ≤ 0.05
