Fig. 1.

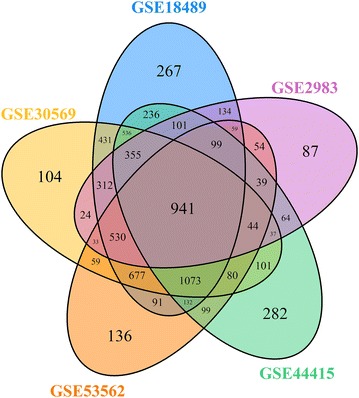
Number of genes with constant expression profiles in S. coelicolor M145. The Venn diagram indicates the number of stably expressed genes based on the time-series transcriptome of M145 cultivated in different conditions

Number of genes with constant expression profiles in S. coelicolor M145. The Venn diagram indicates the number of stably expressed genes based on the time-series transcriptome of M145 cultivated in different conditions