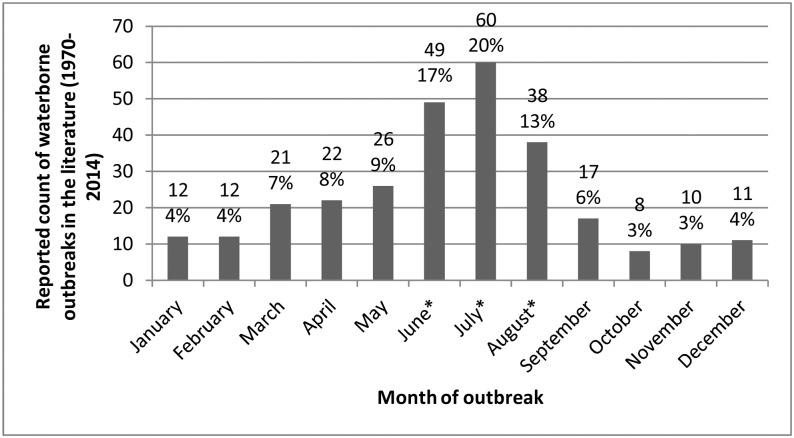
Fig 2. Frequency distribution of waterborne disease outbreaks in small drinking water systems (n = 286^).
Outbreaks reported in the literature, by month, in Canada and the United States (1970–2014). ^Seven outbreak reports did not indicate the month during which the outbreak occurred. *Count in summer months (June, July, August) was significantly different (P < 0.001) from number of outbreaks occurring in other seasons.

