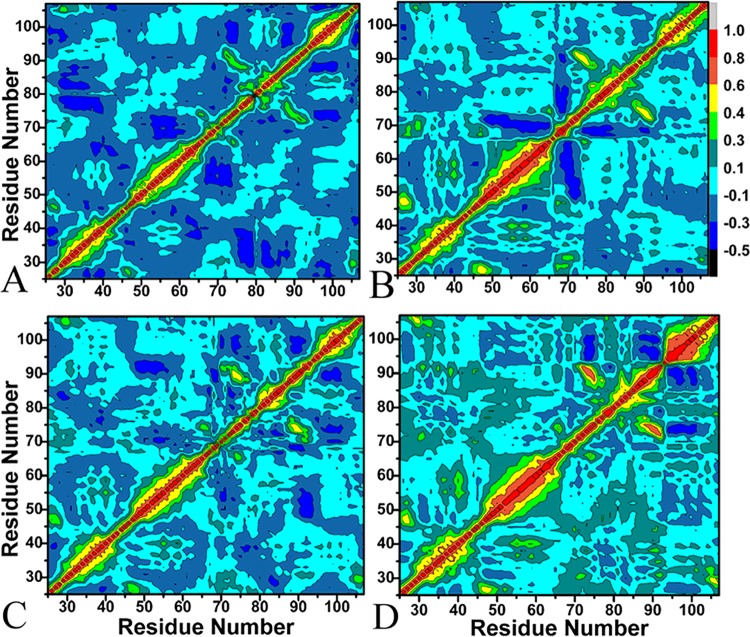
Fig 4. Cross-correlation matrices of the fluctuations of the coordinates for Cα atoms of MDMX around their mean positions during the equilibrium phase of simulations.
The extents of correlated motions and anticorrelated motions are color-coded for four binding complexes: A for PMI-MDMX, B for pDI-MDMX, C for WK23-MDMX and D for WW8-MDMX.

