
Figure 3. Effect of siRNAs specific to HDAC1 and HDAC2 on the proliferation of renal interstitial fibroblasts.
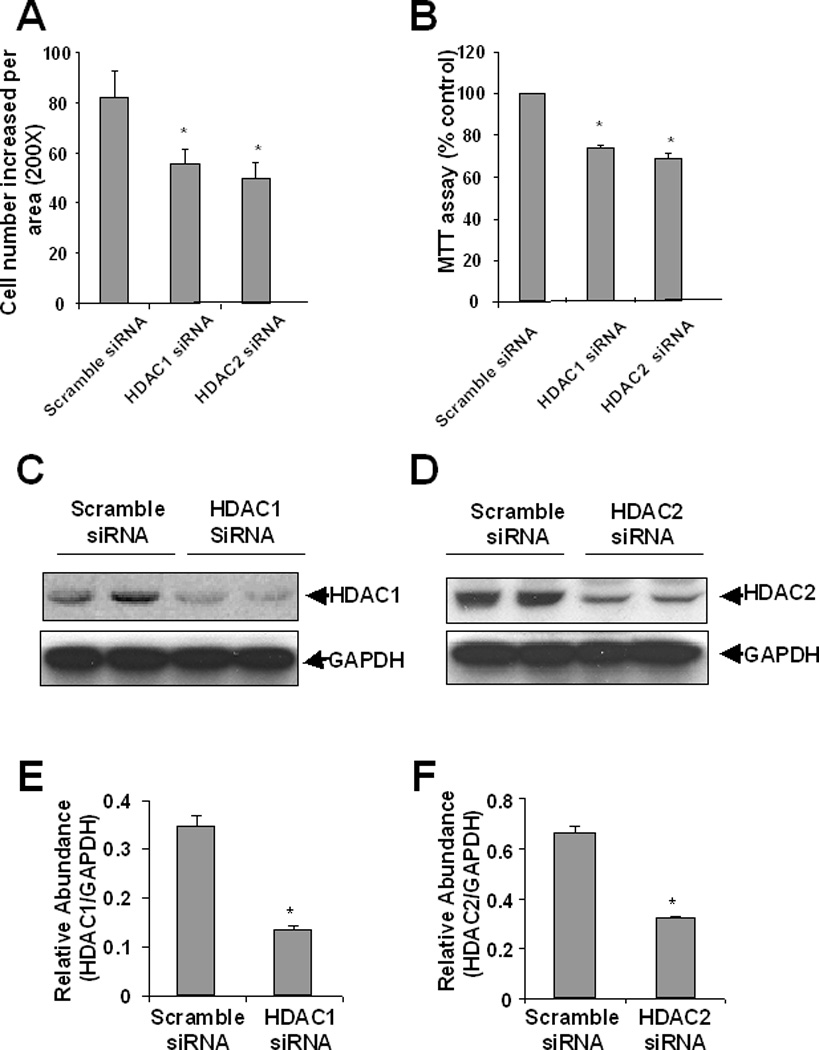
NRK-49F cells were transfected with scrambled siRNA or siRNA specific to HDAC1 and HDAC2, respectively and incubated for 48 h in DMEM with 5% FBS. Cell proliferation was determined by cell counting (A), and the MTT assay (B). Cells were harvested and cell lysates were subjected to immunoblot analysis with antibodies to HDAC1, HDAC2 or GAPDH. Representative immunoblots from 3 or more experiments are shown (C, D). Expression levels of HDAC1, HDAC2 in different groups were quantified by densitometry and normalized with GAPDH (E, F). Data are expressed as means ± S.D. Bars with * are significantly different from controls (p<0.05).