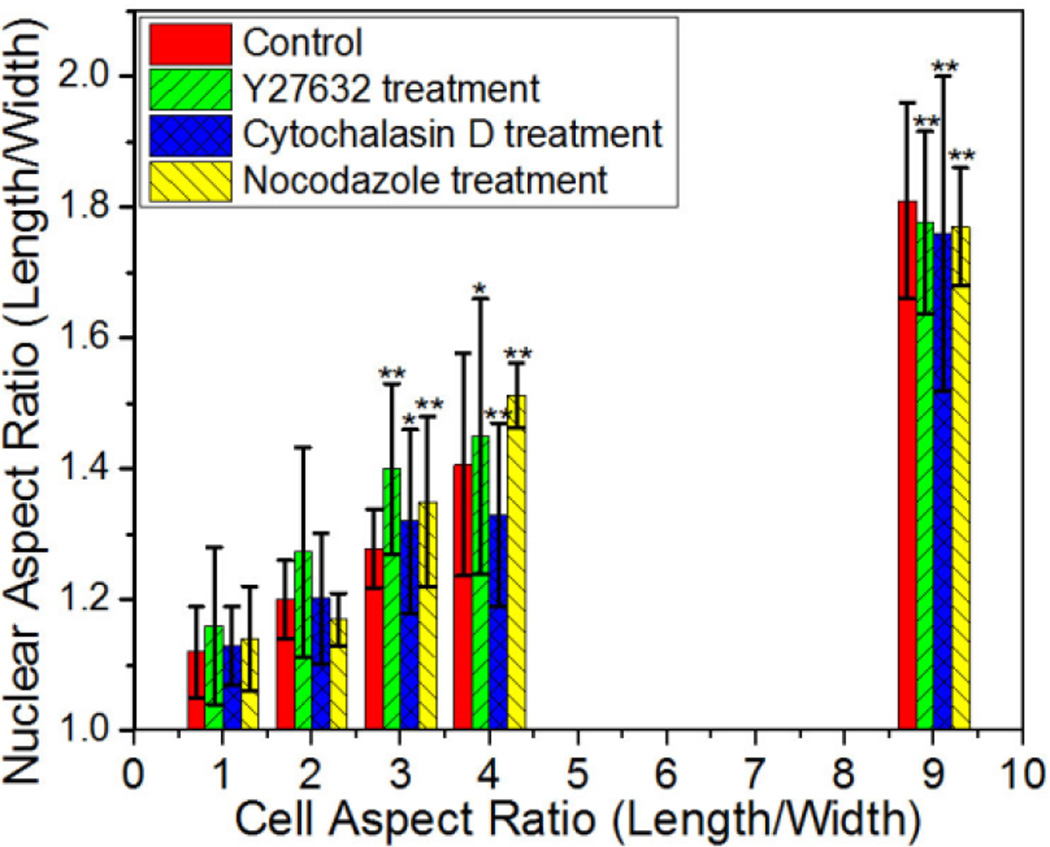
Figure 4.
Quantification of nuclear aspect ratio for NIH 3T3 cells treated with the indicated pharmacological agents on 900 µm2 rectangular patterns. Data are shown as Mean ± SD with 8 ≤ n ≤ 11. ANOVA followed by Tukey's post tests yield the following p values: p=0.07 (ratio 2), p=3.89×10⁻⁴ (ratio 3), p= 2.56×10⁻⁴ (ratio 4), p=2.89×10⁻⁷ (ratio 9) for cytochalasin D; p=0.15 (ratio 2), p=9.64×10⁻⁴ (ratio 3), p= 0.018 (ratio 4), p=4.3×10⁻⁶ (ratio 9) for Y27632; p=0.43 (ratio 2), p=0.0038 (ratio 3), p= 1.4×10⁻⁴ (ratio 4), p=2.21×10⁻⁶ (ratio 9) for nocodazole. Statistical significance is calculated with respect to shape ratio 1 treated for cytochalasin D, Y27632, or nocodazole respectively. *p<0.05, **p<0.005.

