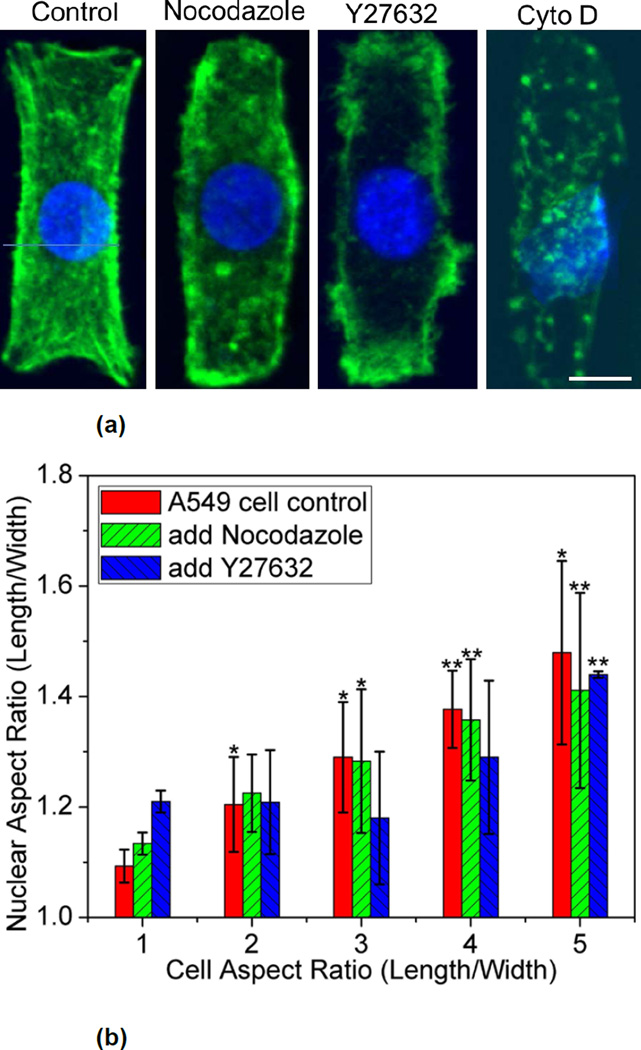
Figure 6.
(a) Representative of nuclei (blue) and actin (green) in A549 cells treated with different pharmacological agents. The scale bar respresents 10 µm. (b) Average the nuclear aspect ratio as a function of the cell aspect ratio in control and nocodazole or Y27632 treated A549 cells on rectangular micropatterns with different aspect ratios. Data are shown as Mean ± SD with 8 ≤ n ≤ 15. ANOVA followed by Tukey's post tests yield the following p values: p=0.13 (ratio 2), p=0.029 (ratio 3), p= 0.0021 (ratio 4), p=0.0033 (ratio 5) for nocodazole; p=0.85 (ratio 2), p=0.75 (ratio 3), p= 0.56 (ratio 4), p=1.01×10⁻⁵ (ratio 5) for Y27632. Statistical significance is calculated with respect to shape ratio 1 in control, nocodazole, or Y27632 treated cells respectively. *p<0.05, **p<0.005.

