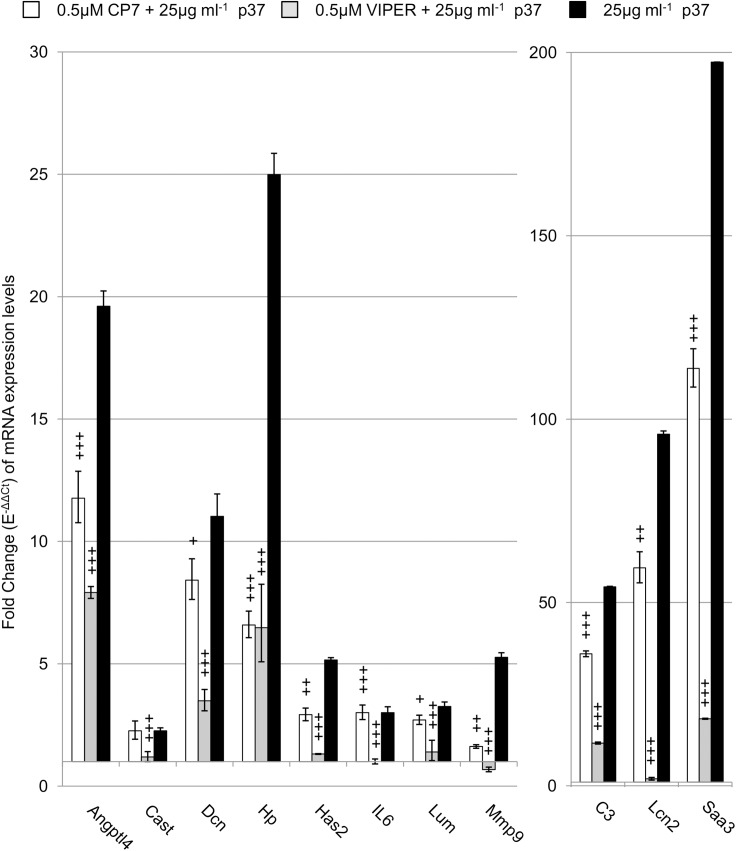
Fig 2. The effect of 0.5 μM VIPER and CP7 on p37-induced gene expression in NIH3T3 fibroblasts.
Quantitative PCR (qPCR) analysis of NIH3T3 fibroblasts treated with 25 μg ml-1 p37 for 24 hours (black) or pre-treated for 2 hours with VIPER (grey) or the control peptide CP7 (white) prior to 25 μg ml-1 p37-treatment for 24 hours. Significant differences between CP7 or VIPER+p37 treatments and p37 treatment were calculated using ANOVA analysis (+p≤0.05, ++p≤0.01, +++p≤0.001).

