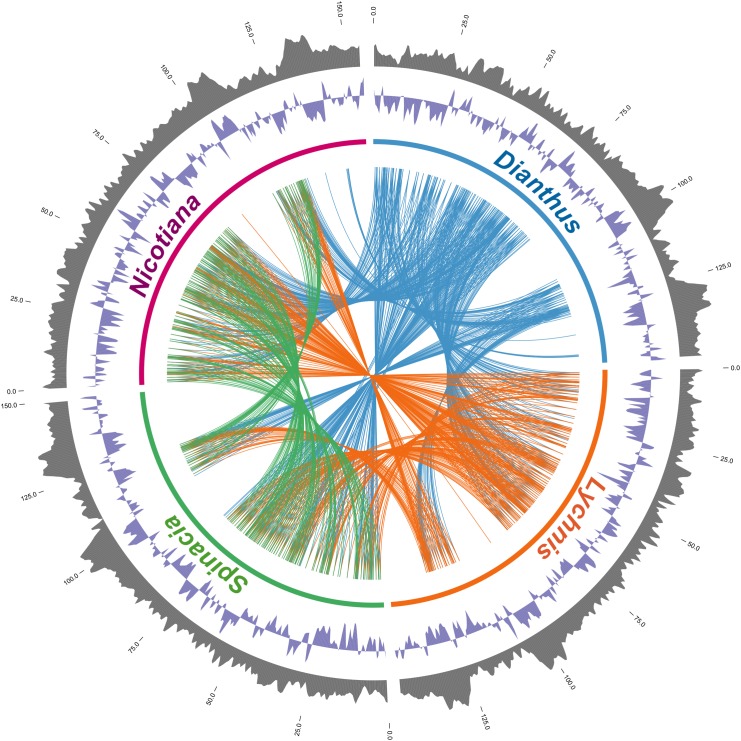
Fig 1. The circos diagram shows the four cp genomes.
The outermost layer and inner layer denotes the % GC content and GC skew in the genome, respectively. The number of each genome indicates the genomic position on the assembly of chloroplast genomes. Similar blocks are connected with lines, and each line represents one unique gene of the genome with the highest similarity between Dianthus and three other cp genomes.

