FIGURE 2:
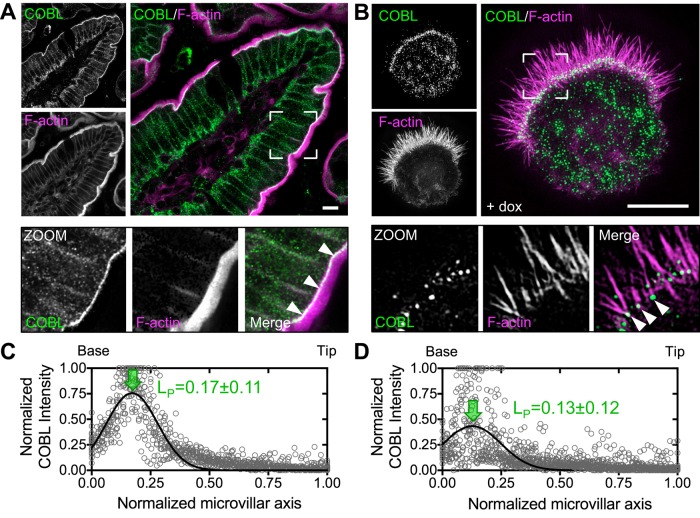
COBL localizes to the base of BB microvilli. (A) Endogenous COBL (green) and F-actin (magenta) labeling in a single villus from mouse small intestine. Boxed corners indicate zoom region, which highlights terminal web localization of COBL. (B) SIM projection of an induced Ls174T-W4 cell showing localization of endogenous COBL (green) and F-actin (magenta). Boxed corners indicate zoom region. (C, D) Line scans (n = 25) parallel to the microvillar axis show the distribution of endogenous COBL in mouse small intestine and Ls174T-W4 cells, respectively. Arrows highlight the peak localization (LP, mean ± SE) along the normalized microvillar axis. Scale bars, 5 μm.

