FIGURE 7:
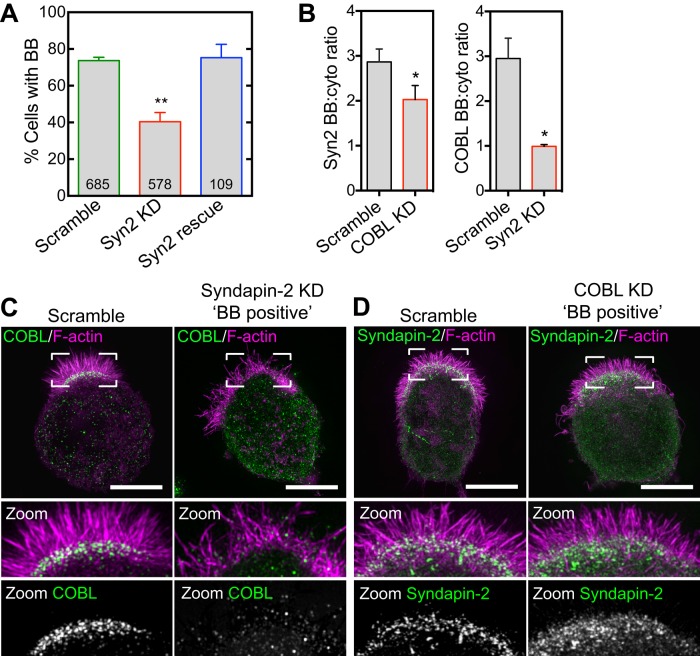
Syndapin-2 targets COBL to the base of the BB. (A) BB formation in response to syndapin-2 KD and rescue. Mean ± SEM from three separate experiments; number per condition is listed within the bars (Student’s t test, **p < 0.004). (B) Left, syndapin-2 BB enrichment in scramble and COBL KD cells. Right, COBL BB enrichment in scramble and syndapin-2 KD cells. Data are displayed as mean ± SEM (Student’s t test, *p < 0.05); 30 cells/condition. (C) SIM projections of COBL immunostaining (green) and F-actin (magenta) in control and syndapin-2 KD cells. Boxed corners indicate zoom region. (D) SIM projections of syndapin-2 immunostaining (green) and F-actin (magenta) in control and COBL KD cells. Boxed corners indicate zoom region. Scale bars, 5 μm.

