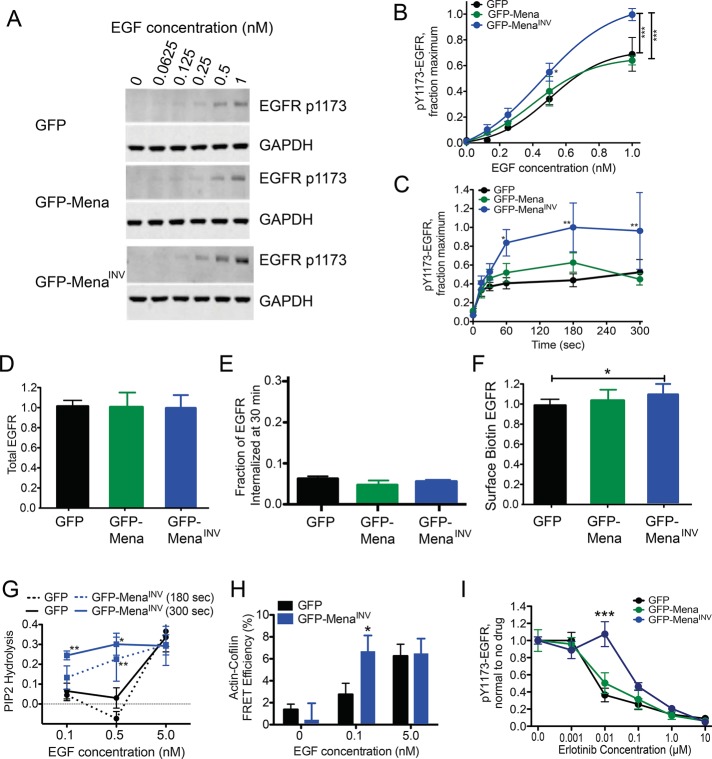
FIGURE 3:
MenaINV expression does not affect EGFR presentation but increases signaling pathway activation at low levels of EGF. (A) Representative Western blot of MDA-MB231 cells expressing GFP, GFP-Mena, or GFP-MenaINV stimulated after bolus stimulation with EGF for 3 min. (B) Quantification of EGFR phosphorylation at Y1173 shown in A by densitometry. Results are mean ± SD; three experiments. Asterisks indicate significant difference by ANOVA with Tukey multiple-comparison test (*p < 0.05 vs. MDA-MB231-GFP cells, ***p < 0.001). (C) Time course of EGFR phosphorylation at Y1173 in response to 0.25 nM EGF. Asterisks indicate significant difference by ANOVA with Tukey multiple-comparison test (*p < 0.05 vs. MDA-MB231-GFP cells at 0.5 nM or **p < 0.01 vs. conditions indicated by bar). (D) Total EGFR protein normalized to GFP control measured by ELISA. n > 10 for each bar in MDA-MB231 cells. Data shown as mean ± SD. (E) Fraction of total EGFR internalized at basal (no EGF) conditions in serum-free medium after 30 min at 37C. Data shown as mean ± range; n = 2. (F) Membrane level of EGFR measured by biotin labeling of surface proteins, EGFR capture ELISA, and detection of protein by HRP-labeled streptavidin in MDA-MB231 cells. Data normalized to GFP control cells in each experiment. Data shown as mean ± SD; n > 10 for each bar. (G) Fraction of PI(4,5)P2 lost from the cell membrane at specified time after EGF stimulation, measured using PLCδ-PH domain FRET assay in MTLn3 cells. *p < 0.05 and **p < 0.01 vs. GFP at respective time point using ANOVA with Tukey posttest. (H) Cofilin activity, reflected by the amount of cofilin bound to actin quantified by an antibody FRET assay 300 s after EGF stimulation in MTLn3 cells. *p < 0.05 vs. GFP at respective EGF concentration using two-tailed t test. (I) EGFR phosphorylation dose-response 3 min poststimulation with 1 nM EGF and increasing erlotinib in MDA-MB231 cells. Data shown as mean ± SEM; ***p < 0.001 vs. MDA-MB231-GFP and GFP-Mena by two-way ANOVA. See Supplemental Figure S3.

