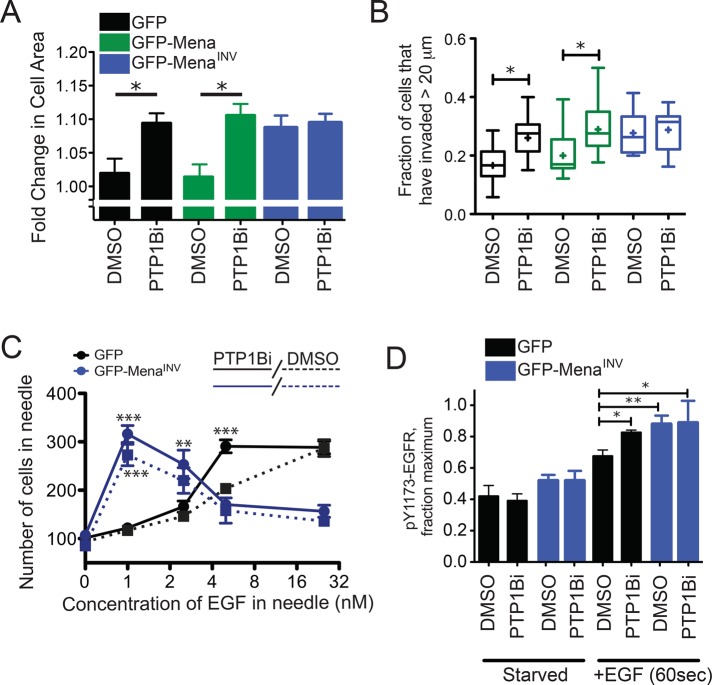
FIGURE 5:
Inhibition of PTP1B mimics the effects of MenaINV expression. (A) Lamellipodial protrusion of MDA-MB231 cells 8 min poststimulation with 0.25 nM EGF after incubation with 0.1% DMSO or 10 μM PTP1B inhibitor for 60 min. Results are mean with 95% confidence intervals; 48 cells/condition. Asterisk indicates significant difference by ANOVA with Tukey multiple-comparison test (*p < 0.05). (B) 3D collagen invasion after 24 h in the presence of 0.25 nM EGF and 0.1% DMSO or 10 μM PTP1B inhibitor. Results are represented as box and whiskers at 5 and 95% percentiles; cross indicates mean value; five assays/condition. Asterisk indicates significant difference by nonparametric Kruskal–Wallis test and Dunn’s multiple-comparison test (*p < 0.05). (C) EGF dose-response of invasive cells collected from MTLn3 xenograft tumors expressing GFP (black solid and dotted lines) or GFP-MenaINV (blue solid or dotted lines). Needles contained EGF and 0.01% DMSO without (dotted lines) or with10 μM PTP1B inhibitor (solid lines). Results are mean ± SEM and plotted on log 2 x-axis; more than three tumors for conditions with error bars; one tumor for conditions without error bars. Asterisks indicate significant difference by nonparametric Kruskal–Wallis test and Dunn’s multiple-comparison test (**p < 0.01 or ***p < 0.001) at each concentration of EGF for conditions with more than three tumors. (D) EGFR phosphorylation at Y1173 (0.25 nM EGF, 3 min) after 60 min of preincubation with 0.1% DMSO or 10 μM PTP1B inhibitor after 4 h of serum starvation. Results are mean ± SEM; three experiments. Asterisks indicate significant difference by ANOVA with Student-Newman-Keuls multiple-comparison test (*p < 0.05, **p < 0.01). See also Supplemental Figure S5 and Supplemental Table S6.

