FIGURE 6:
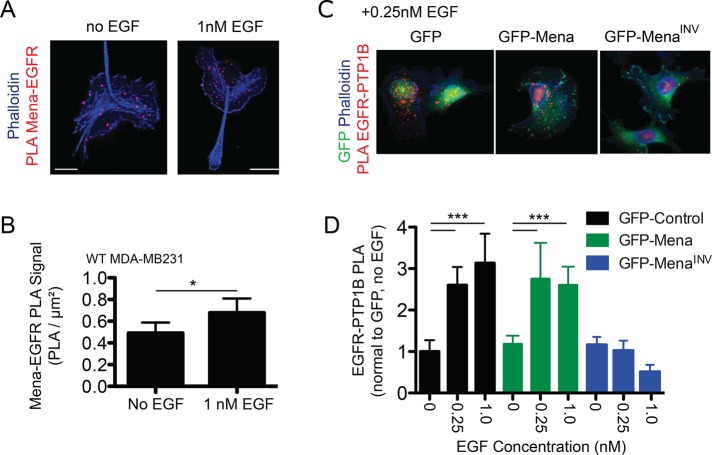
PTP1B recruitment to EGFR is abrogated in cells expressing MenaINV. (A) Representative images for Mena-EGFR PLA ± EGF (1 nM, 60 s). Phalloidin shown in blue, and Mena-EGFR PLA shown in red. (B) Quantification of Mena-EGFR PLA in wild-type MDA-MB231 cells ± EGF (1 nM, 60 s). Asterisk indicates significant difference by two-tailed t test (*p < 0.05). (C) Representative images for EGFR-PTP1B PLA for MDA-MB231 cells expressing GFP, GFP-Mena, or GFP-MenaINV stimulated with 0.25 nM EGF for 60 s. GFP signal shown in green, phalloidin shown in blue, and EGFR-PTP1B PLA shown in red. (D) Quantification of EGFR-PTP1B PLA ± 0.25 nM EGF for 60 s. Data are mean with 95% confidence interval; >20 cells/condition. Asterisks indicate significant difference by ANOVA with Tukey multiple-comparison test (***p < 0.001).

