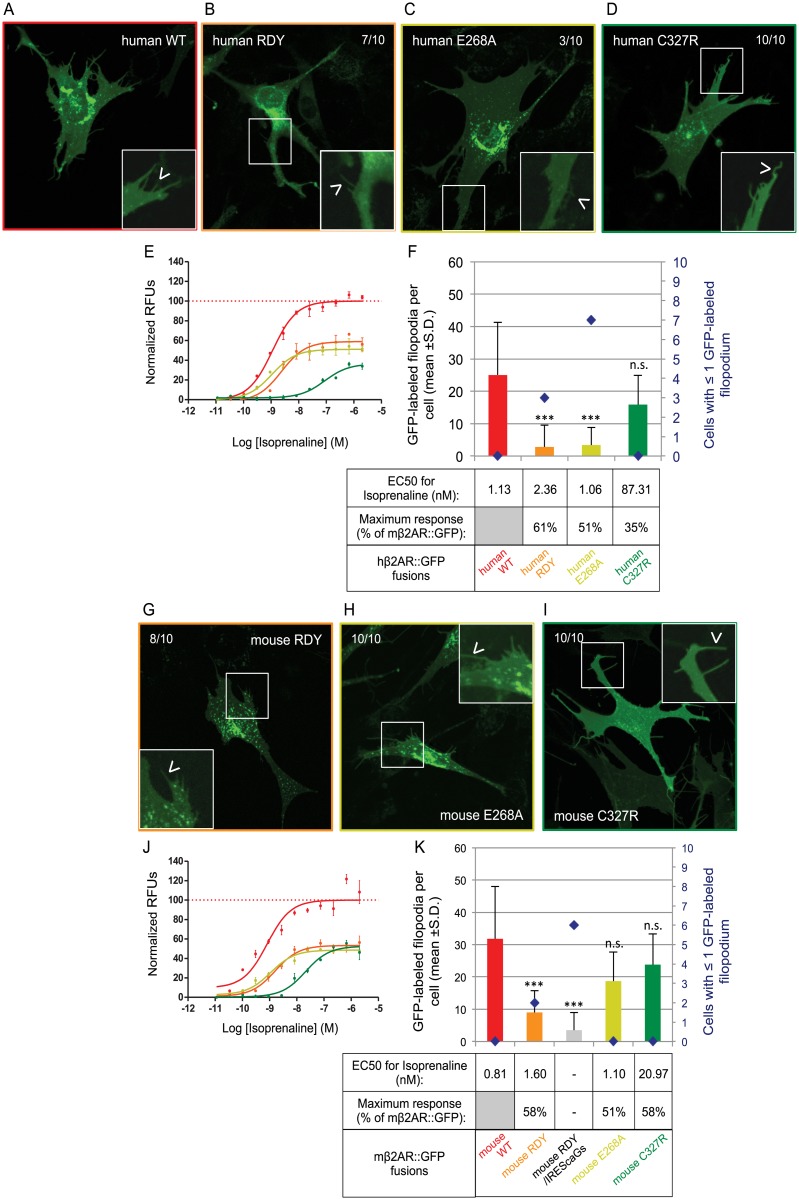
Fig 4. Plasma membrane trafficking of human and mouse β2AR mutants for activity.
(A) The human version of β2AR::GFP shows an homogenous staining in OP6 cells, similar in localization to mβ2AR::GFP, but more faint (observed in 10/10 cells). The protein also locates to small isolated inclusions and filopodia (arrow head in magnified picture), also at a lower level than mβ2AR::GFP. In this figure all zoom-in pictures are corrected for contrast to allow good display of filopodia. (B) On the contrary, the activity mutant human RDY shows accumulation in the periphery of the nucleus and locate in fewer filopodia (7/10 cells, arrow head in magnified picture). (C) The human E268A protein shows uniform and faint staining of the cell in addition to small inclusions, but rarely locates to filopodia (only in 3/10 cells, arrow head in magnified picture). (D) Human C327R shows similar localization than human WT and locates to filopodia (10/10 cells, arrow head in magnified picture). (E) Dose response curves to isoprenaline obtained by FLIPR analysis, are showed as normalized relative fluorescent units (RFUs) as a function of Log [isoprenaline] (M). The same color code is used as in F. (F) The average number of GFP-labeled filopodia per cell is showed (bars in graph, mean +s.d.) as well as the number of cells with ≤1 GFP-labeled filopodia (blue diamonds). Human WT labels 25.0 ±10.7 filopodia per cell, human RDY only 2.8 ±1.7***, human E268A 3.4 ±7.3*** and human C327R 15.9 ±9.7n.s.. ***means significantly different from hβ2AR::GFP, one-way ANOVA 3 degrees of freedom followed by Scheffe tests, p<0.001. n.s. means not significantly different from hβ2AR::GFP, p>0.001. EC50 (nM) and maximum response (expressed as a % of hβ2AR::GFP’s maximum response) for isoprenaline are indicated in the table. (G) As the human version, mouse RDY shows normal localization inside the cell (8/10 cells) but traffic to only few filopodia (arrow head in magnified picture). (H) However, mouse E268A does not behave like human E268A, it shows normal localization inside the cell (10/10 cells) and in filopodia (arrow head in magnified picture). (I) Mouse C327R, as the human version and as WT, shows homogenous staining of the cell and few inclusions (10/10 cells) and locates to filopodia (arrow head in magnified picture). (J) Dose response curves to isoprenaline obtained by FLIPR analysis, are showed as normalized relative fluorescent units (RFUs) as a function of Log [isoprenaline] (M). The same color code is used as in K. (K) The average number of GFP-labeled filopodia per cell is showed (bars in graph, mean +s.d.) as well as the number of cells with ≤1 GFP-labeled filopodium (blue diamonds). Mouse WT labels 31.8 ±16.2 filopodia per cell, mouse RDY 9.0 ±6.7***, mouse RDY/IREScaGs 3.5 ±5.5***, mouse E268A 18.7 ±9.0n.s. and mouse C327R 23.8 ±9.5n.s.. ***means significantly different from WT, one-way ANOVA 4 degrees of freedom followed by Scheffe tests, p<0.001. n.s. means not significantly different from WT, p>0.001. EC50 (nM) and maximum response (expressed as a % of mβ2AR::GFP’s maximum response) for isoprenaline are indicated in the table. Mouse RDY/IREScaGs was not tested for activity.

