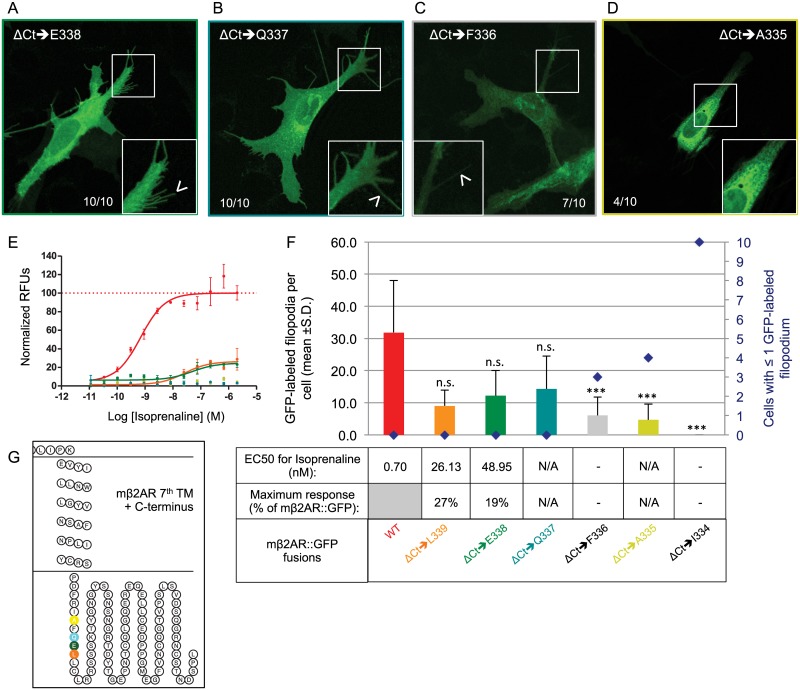
Fig 5. Minimal Ct requirements for mouse β2AR plasma membrane trafficking and activity.
(A and B) Truncation of the Ct of mβ2AR to E338 and Q337 does not impair proper trafficking of the protein in the cell (both 10/10 cells) and ΔCt➔E338 and ΔCt➔Q337 successfully traffics to filopodia in both cases (arrow head in magnified pictures). (C and D) On the contrary, truncated proteins to F336 and A335 show accumulation at the margin of the nucleus and very rarely locate to filopodia (arrow head in magnified pictures). (E) Dose response curves to isoprenaline obtained by FLIPR analysis, are showed as normalized relative fluorescent units (RFUs) as a function of Log [isoprenaline] (M). The same color code is used as in F. (F) The average number of GFP-labeled filopodia per cell is showed (bars in graph, mean +s.d.) as well as the number of cells with ≤1 GFP-labeled filopodium (blue diamonds). ΔCt➔L339 labels 9.0 ±4.9n.s. filopodia per cell, ΔCt➔E338 12.2 ±7.9 n.s., ΔCt➔Q337 14.3 ±10.2 n.s., ΔCt➔F336 6.0 ±5.7***, ΔCt➔A335 13.5 ±10.1*** and ΔCt➔I334 0.0 ±0.0***. ***means significantly different from WT, one-way ANOVA 6 degrees of freedom followed by Scheffe tests, p<0.001. n.s. means not significantly different from WT, p>0.001. EC50 (nM) and maximum response (expressed as a % of mβ2AR::GFP’s maximum response) for isoprenaline are indicated in the table. (G) Snake plot of the 7th and last transmembrane domain and the Ct of the protein showing the localization of the last residues included in the truncation series.

