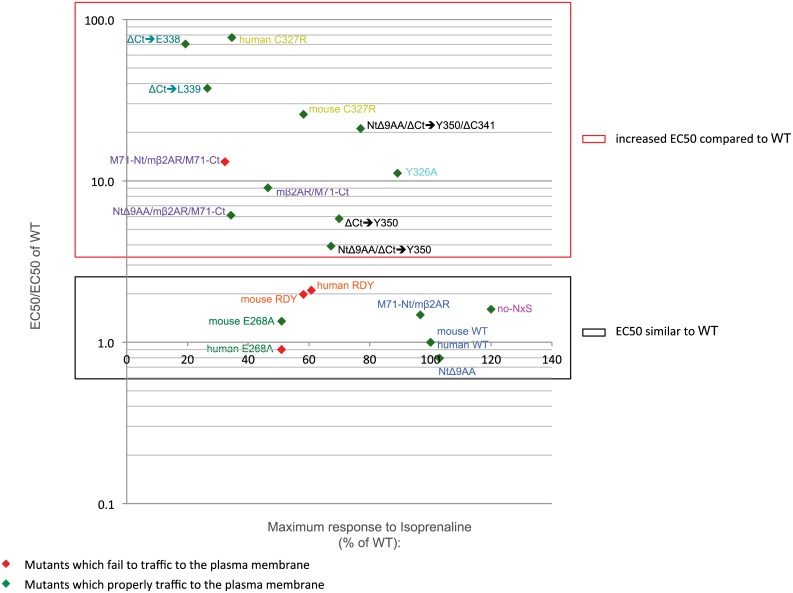
Fig 8. Plot for relative EC50 and % of maximum response.
All mutants are positioned for their relative EC50 for isoprenaline (EC50/EC50 of WT) on the y-axis (log scale) and their maximum response as a % of WT on the x-axis. Mutants that fail to traffic to the plasma membrane are depicted as red diamonds and mutants that properly traffic to the plasma membrane are depicted as green diamonds. The red box indicates all the mutants with a lower affinity for isoprenaline than WT i.e. EC50/EC50 of WT >>1 (from 3.9 to 77.4). All these mutants have mutations in the last 7th transmembrane domain or the Ct of the protein. The black box includes all the mutants that have a similar affinity for isoprenaline than WT i.e. EC50/EC50 of β2AR::GFP ≈ 1 (from 0.8 to 2.1).

