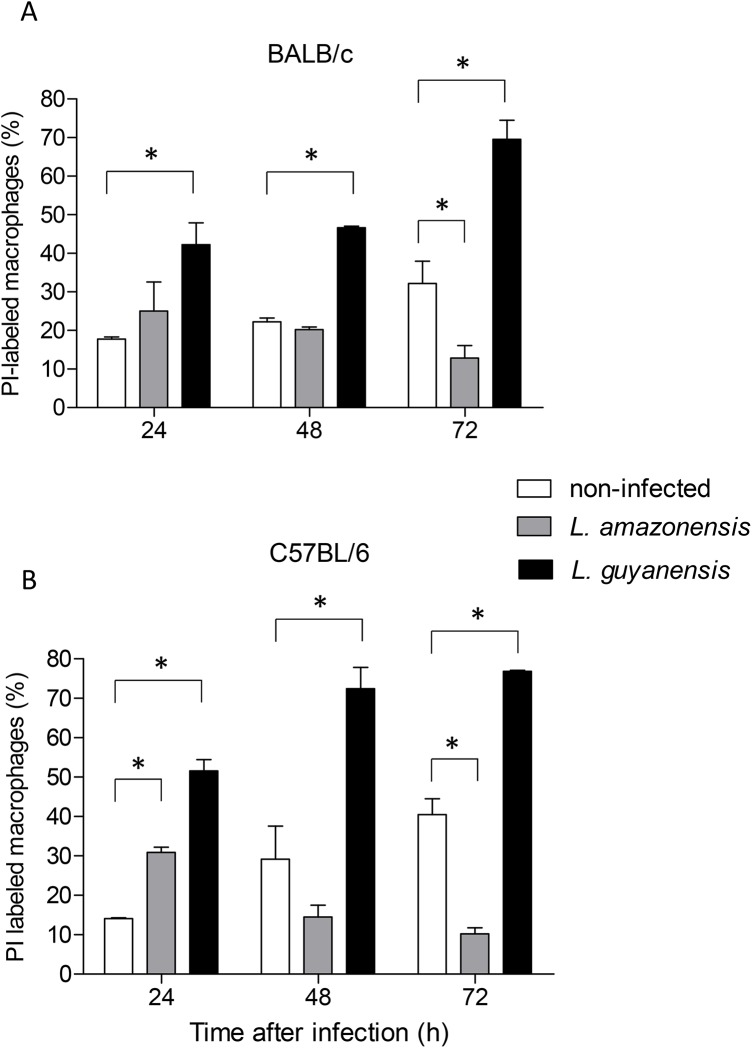
Fig 3. Loss of macrophage membrane integrity after in vitro infection with L. amazonensis or L. guyanensis.
Peritoneal macrophages of BALB/c (A) or C57BL/6 (B) mice infected or not with L. amazonensis or L. guyanensis were incubated with PI and analyzed by flow cytometry at the time points indicated. Values represent percentage of PI positive cells in culture. Bars represent mean ± SE of two or three (depending on the time point) independent experiments. Statistically significant differences between the two groups indicated, at a P < 0.05, are represented by (*). One typical experiment is shown in dot plots after macrophage gating and analysis by FlowJo (Fig 3C). Gating strategy is shown in S1A Fig.

