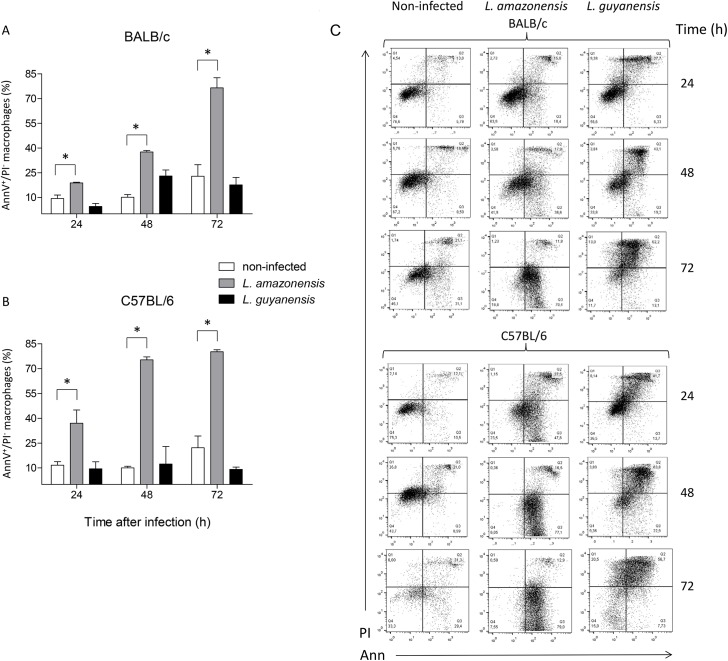
Fig 4. Exposure of PS by macrophages after in vitro infection with L. amazonensis or L. guyanensis.
Peritoneal macrophages of BALB/c (A) or C57BL/6 (B) mice infected or not with L. amazonensis or L. guyanensis were labeled with AnnV-FITC and counterstained with PI. Analysis was carried out by flow cytometry and only initial moments of apoptosis (AnnV+/PI-) were considered at the indicated time points. Bars represent mean ± SE of two or three (depending on the time point) independent experiments. Statistically significant differences between the two groups indicated, at a P < 0.05, are represented by (*). A typical experiment is shown in dot plots after macrophage gating and analysis by FlowJo (C). Gating strategy is shown in S1A Fig.

